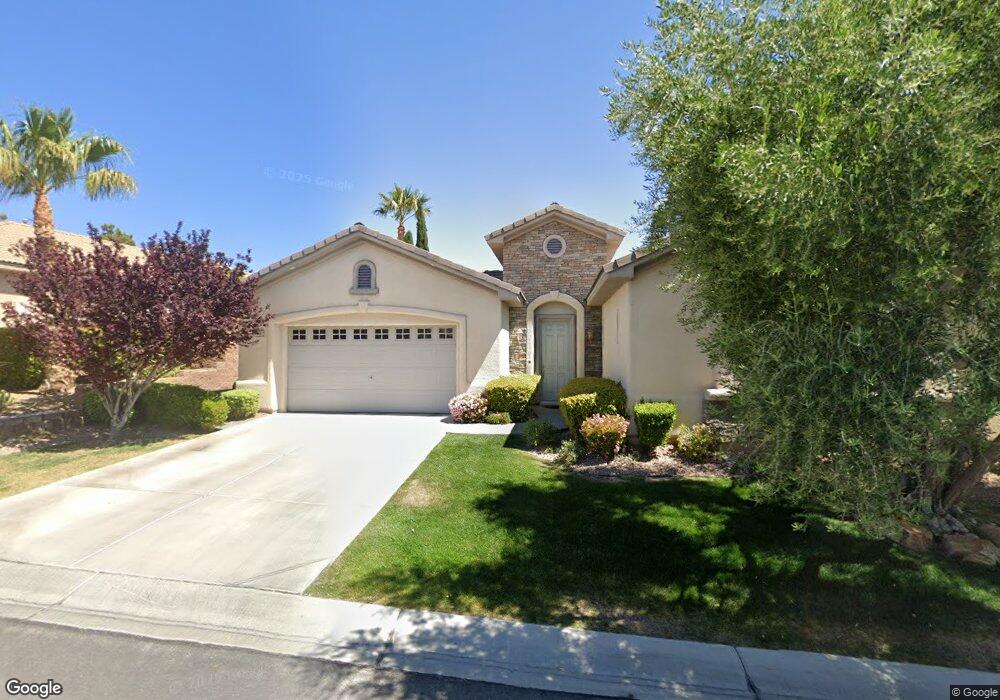
11632 La Mirago Place Unit 3 Las Vegas, NV 89138
Estimated Value: $869,001 - $1,119,000
4
Beds
4
Baths
2,805
Sq Ft
$365/Sq Ft
Est. Value
About This Home
This home is located at 11632 La Mirago Place Unit 3, Las Vegas, NV 89138 and is currently estimated at $1,022,750, approximately $364 per square foot. 11632 La Mirago Place Unit 3 is a home located in Clark County with nearby schools including Linda Rankin Givens Elementary School, Sig Rogich Middle School, and Palo Verde High School.
Ownership History
Date
Name
Owned For
Owner Type
Purchase Details
Closed on
May 16, 2023
Sold by
Ortega Family Trust
Bought by
Ortega Steven M
Current Estimated Value
Home Financials for this Owner
Home Financials are based on the most recent Mortgage that was taken out on this home.
Original Mortgage
$664,000
Outstanding Balance
$645,164
Interest Rate
6.28%
Mortgage Type
New Conventional
Estimated Equity
$377,586
Purchase Details
Closed on
Jun 15, 2015
Sold by
Ortega Peter C and Ortega Donna M
Bought by
Ortega Family Trust
Purchase Details
Closed on
Sep 30, 2004
Sold by
Pratte Trevor
Bought by
Ortega Peter and Ortega Donna
Home Financials for this Owner
Home Financials are based on the most recent Mortgage that was taken out on this home.
Original Mortgage
$499,950
Interest Rate
8.1%
Mortgage Type
Unknown
Purchase Details
Closed on
Mar 28, 2003
Sold by
William Lyon Homes Inc
Bought by
Pratte Trevor
Create a Home Valuation Report for This Property
The Home Valuation Report is an in-depth analysis detailing your home's value as well as a comparison with similar homes in the area
Home Values in the Area
Average Home Value in this Area
Purchase History
| Date | Buyer | Sale Price | Title Company |
|---|---|---|---|
| Ortega Steven M | -- | Driggs Title Agency | |
| Ortega Family Trust | -- | None Available | |
| Ortega Peter | $630,000 | Old Republic Title Co Of Nv | |
| Pratte Trevor | $340,045 | Fidelity National Title |
Source: Public Records
Mortgage History
| Date | Status | Borrower | Loan Amount |
|---|---|---|---|
| Open | Ortega Steven M | $664,000 | |
| Previous Owner | Ortega Peter | $499,950 |
Source: Public Records
Tax History Compared to Growth
Tax History
| Year | Tax Paid | Tax Assessment Tax Assessment Total Assessment is a certain percentage of the fair market value that is determined by local assessors to be the total taxable value of land and additions on the property. | Land | Improvement |
|---|---|---|---|---|
| 2025 | $4,548 | $208,644 | $91,700 | $116,944 |
| 2024 | $4,666 | $208,644 | $91,700 | $116,944 |
| 2023 | $4,880 | $174,875 | $64,050 | $110,825 |
| 2022 | $4,288 | $156,675 | $55,650 | $101,025 |
| 2021 | $4,161 | $145,478 | $49,350 | $96,128 |
| 2020 | $4,037 | $141,705 | $46,550 | $95,155 |
| 2019 | $3,896 | $134,493 | $43,750 | $90,743 |
| 2018 | $3,715 | $123,877 | $36,750 | $87,127 |
| 2017 | $3,971 | $120,949 | $32,900 | $88,049 |
| 2016 | $3,477 | $113,303 | $25,725 | $87,578 |
| 2015 | $3,470 | $111,133 | $25,725 | $85,408 |
| 2014 | $3,369 | $99,499 | $15,803 | $83,696 |
Source: Public Records
Map
Nearby Homes
- 216 Muldowney Ln
- 11554 Trevi Fountain Ave
- 11589 Caldicot Dr
- 11730 Stonewall Springs Ave
- 11741 Stonewall Springs Ave
- 12230 Elderwood St
- 454 Carter House Ave
- 489 Carter House Ave
- 11831 Giroma Ave
- 11815 Corenzio Ave
- 11834 Albissola Ave
- 11849 Saverio Ave
- 213 Villa Borghese St
- 11826 Corenzio Ave
- 11813 Pippa Ave
- 11672 Barga Ct
- 342 Molinetto St
- 225 Robledo St
- 97 Sarabeth St
- 281 Gandara St
- 11628 La Mirago Place Unit 3
- 11636 La Mirago Place
- 81 Chapman Heights St
- 80 Antique Garden St
- 11633 La Mirago Place Unit 3
- 85 Chapman Heights St
- 11629 La Mirago Place
- 11637 La Mirago Place
- 11612 Cameo Ave
- 11641 La Mirago Place Unit 3
- 11625 La Mirago Place Unit n/a
- 11625 La Mirago Place Unit 3
- 73 Chapman Heights St
- 76 Antique Garden St
- 11608 Cameo Ave
- 11701 La Mirago Place Unit 3
- 77 Antique Garden St
- 11621 La Mirago Place
- 11724 Feinberg Place Unit 1 Story/Pool
- 11724 Feinberg Place