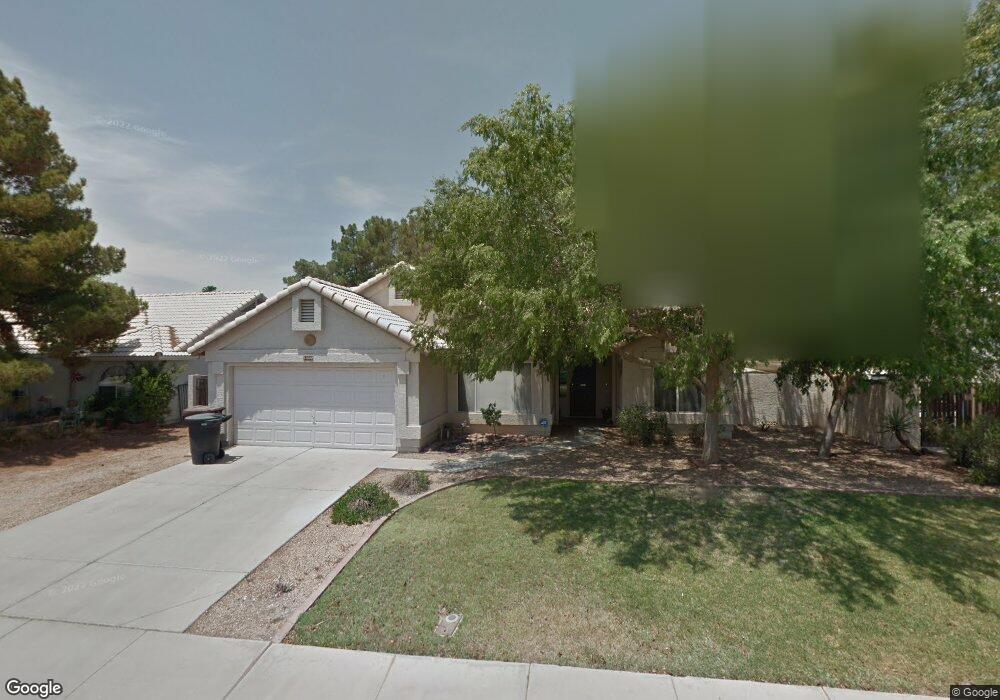
11632 N 76th Ln Peoria, AZ 85345
Estimated Value: $336,736 - $435,000
--
Bed
3
Baths
1,606
Sq Ft
$252/Sq Ft
Est. Value
About This Home
This home is located at 11632 N 76th Ln, Peoria, AZ 85345 and is currently estimated at $405,184, approximately $252 per square foot. 11632 N 76th Ln is a home located in Maricopa County with nearby schools including Peoria Elementary School, Peoria High School, and Academy of Math & Science - Peoria Advanced.
Ownership History
Date
Name
Owned For
Owner Type
Purchase Details
Closed on
Apr 2, 2020
Sold by
Harmon Jennifer R and Harmon Rodney M
Bought by
Harmon Jennifer R
Current Estimated Value
Purchase Details
Closed on
Feb 12, 2020
Sold by
Harmon Jennifer R and Harmon Rodney M
Bought by
Harmon Jennifer R
Purchase Details
Closed on
Nov 10, 2005
Sold by
Harmon Rod
Bought by
Harmon Rodney M and Harmon Jennifer
Home Financials for this Owner
Home Financials are based on the most recent Mortgage that was taken out on this home.
Original Mortgage
$176,000
Interest Rate
5.93%
Mortgage Type
New Conventional
Purchase Details
Closed on
May 22, 1998
Sold by
Bradshaw Richard D
Bought by
Harmon Rod
Home Financials for this Owner
Home Financials are based on the most recent Mortgage that was taken out on this home.
Original Mortgage
$74,900
Interest Rate
7.1%
Mortgage Type
New Conventional
Create a Home Valuation Report for This Property
The Home Valuation Report is an in-depth analysis detailing your home's value as well as a comparison with similar homes in the area
Home Values in the Area
Average Home Value in this Area
Purchase History
| Date | Buyer | Sale Price | Title Company |
|---|---|---|---|
| Harmon Jennifer R | -- | None Available | |
| Harmon Jennifer R | -- | None Available | |
| Harmon Rodney M | -- | Chicago Title Insurance Co | |
| Harmon Rod | $106,900 | Capital Title Agency |
Source: Public Records
Mortgage History
| Date | Status | Borrower | Loan Amount |
|---|---|---|---|
| Closed | Harmon Rodney M | $176,000 | |
| Closed | Harmon Rod | $74,900 |
Source: Public Records
Tax History Compared to Growth
Tax History
| Year | Tax Paid | Tax Assessment Tax Assessment Total Assessment is a certain percentage of the fair market value that is determined by local assessors to be the total taxable value of land and additions on the property. | Land | Improvement |
|---|---|---|---|---|
| 2025 | $994 | $13,132 | -- | -- |
| 2024 | $1,007 | $12,507 | -- | -- |
| 2023 | $1,007 | $28,380 | $5,670 | $22,710 |
| 2022 | $986 | $21,910 | $4,380 | $17,530 |
| 2021 | $1,056 | $20,070 | $4,010 | $16,060 |
| 2020 | $1,065 | $18,600 | $3,720 | $14,880 |
| 2019 | $1,031 | $17,030 | $3,400 | $13,630 |
| 2018 | $997 | $15,830 | $3,160 | $12,670 |
| 2017 | $997 | $13,210 | $2,640 | $10,570 |
| 2016 | $987 | $12,820 | $2,560 | $10,260 |
| 2015 | $921 | $11,710 | $2,340 | $9,370 |
Source: Public Records
Map
Nearby Homes
- 7545 W Jenan Dr
- 11221 N 77th Ave
- 11640 N 74th Dr
- 11231 N 77th Dr
- 11507 N 79th Dr
- 7638 W Shaw Butte Dr
- 11535 N 79th Dr Unit 2
- 7953 W Kirby St
- 7920 W Greer Ave
- 7995 W Kirby St Unit 38A
- 7318 W Greer Ave
- 7243 W Sierra St
- 10955 N 79th Ave Unit 163
- 10955 N 79th Ave Unit 113
- 10955 N 79th Ave Unit 60
- 10955 N 79th Ave Unit 40
- 10955 N 79th Ave Unit 179
- 10955 N 79th Ave Unit 147
- 7266 W Cherry Hills Dr
- 7825 W Bloomfield Rd
- 11622 N 76th Ln
- 11642 N 76th Ln
- 11621 N 77th Dr
- 11752 N 76th Ln
- 11612 N 76th Ln
- 11609 N 77th Dr
- 11643 N 76th Ln
- 11703 N 77th Dr
- 11633 N 76th Ln
- 11603 N 77th Dr
- 11762 N 76th Ln
- 11602 N 76th Ln
- 11623 N 76th Ln
- 11709 N 77th Dr
- 7715 W Canterbury Dr
- 7654 W Jenan Dr
- 7714 W Canterbury Dr
- 11642 N 76th Dr
- 11632 N 76th Dr
- 11613 N 76th Ln