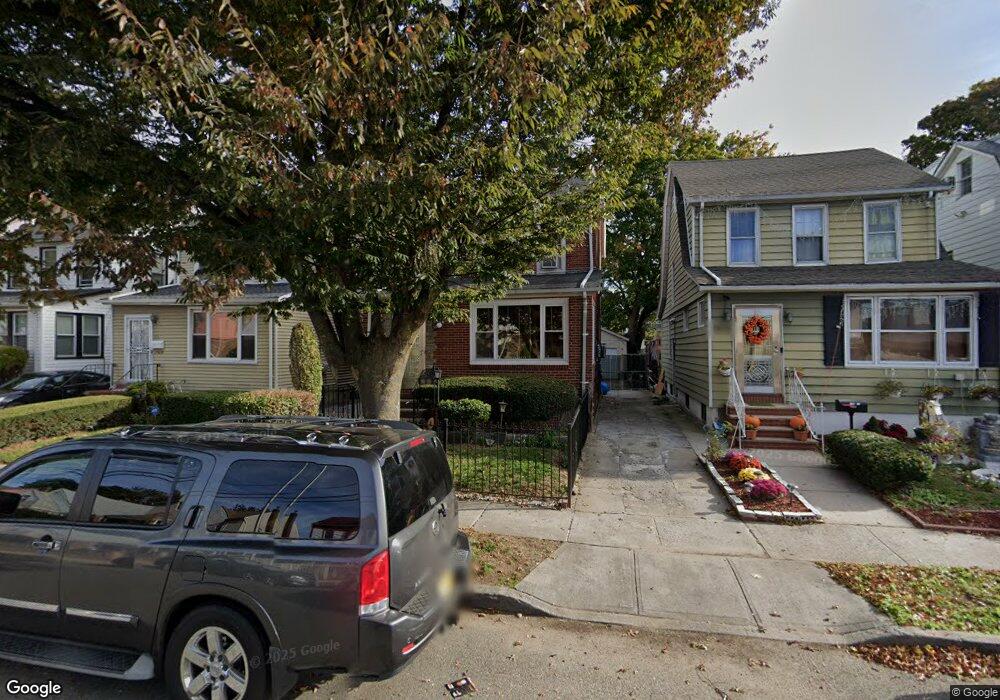
11633 202nd St Saint Albans, NY 11412
Saint Albans NeighborhoodEstimated Value: $617,565 - $709,000
--
Bed
--
Bath
1,265
Sq Ft
$520/Sq Ft
Est. Value
About This Home
This home is located at 11633 202nd St, Saint Albans, NY 11412 and is currently estimated at $657,641, approximately $519 per square foot. 11633 202nd St is a home located in Queens County with nearby schools including P.S. 136 Roy Wilkins, I.S. 192 The Linden, and Riverton Street Charter School.
Ownership History
Date
Name
Owned For
Owner Type
Purchase Details
Closed on
Aug 18, 2006
Sold by
Britt Kiameshya and Britt Valerie
Bought by
Britt Valerie
Current Estimated Value
Purchase Details
Closed on
Jun 30, 2005
Sold by
Tradewinds Enterprises Corp
Bought by
Britt Kiameshya and Britt Valerie
Home Financials for this Owner
Home Financials are based on the most recent Mortgage that was taken out on this home.
Original Mortgage
$350,100
Outstanding Balance
$182,874
Interest Rate
5.67%
Mortgage Type
Purchase Money Mortgage
Estimated Equity
$474,767
Purchase Details
Closed on
Jan 20, 2005
Sold by
Brown Cynthia
Bought by
Tradewinds Enterprises Corp
Purchase Details
Closed on
Apr 12, 2003
Sold by
Brown Cynthia and Brown Jacob
Bought by
Brown Cynthia
Purchase Details
Closed on
Jul 24, 1999
Sold by
Brown Jacob
Bought by
Brown Jacob and Brown Cynthia
Home Financials for this Owner
Home Financials are based on the most recent Mortgage that was taken out on this home.
Original Mortgage
$144,000
Interest Rate
7.68%
Mortgage Type
Balloon
Create a Home Valuation Report for This Property
The Home Valuation Report is an in-depth analysis detailing your home's value as well as a comparison with similar homes in the area
Home Values in the Area
Average Home Value in this Area
Purchase History
| Date | Buyer | Sale Price | Title Company |
|---|---|---|---|
| Britt Valerie | -- | -- | |
| Britt Valerie | -- | -- | |
| Britt Kiameshya | $389,000 | -- | |
| Britt Kiameshya | $389,000 | -- | |
| Tradewinds Enterprises Corp | $291,000 | -- | |
| Tradewinds Enterprises Corp | $291,000 | -- | |
| Brown Cynthia | -- | -- | |
| Brown Cynthia | -- | -- | |
| Brown Jacob | -- | Stewart Title Insurance Co | |
| Brown Jacob | -- | Stewart Title Insurance Co |
Source: Public Records
Mortgage History
| Date | Status | Borrower | Loan Amount |
|---|---|---|---|
| Open | Britt Kiameshya | $350,100 | |
| Closed | Britt Kiameshya | $350,100 | |
| Previous Owner | Brown Jacob | $144,000 | |
| Closed | Britt Valerie | $0 |
Source: Public Records
Tax History Compared to Growth
Tax History
| Year | Tax Paid | Tax Assessment Tax Assessment Total Assessment is a certain percentage of the fair market value that is determined by local assessors to be the total taxable value of land and additions on the property. | Land | Improvement |
|---|---|---|---|---|
| 2025 | $2,211 | $26,307 | $6,577 | $19,730 |
| 2024 | $2,223 | $24,818 | $7,256 | $17,562 |
| 2023 | $2,070 | $23,414 | $6,490 | $16,924 |
| 2022 | $2,033 | $32,280 | $10,560 | $21,720 |
| 2021 | $2,086 | $31,440 | $10,560 | $20,880 |
| 2020 | $4,344 | $30,660 | $10,560 | $20,100 |
| 2019 | $4,034 | $30,660 | $10,560 | $20,100 |
| 2018 | $3,680 | $19,512 | $7,931 | $11,581 |
| 2017 | $3,648 | $19,368 | $8,375 | $10,993 |
| 2016 | $3,461 | $19,368 | $8,375 | $10,993 |
| 2015 | $1,984 | $18,269 | $9,134 | $9,135 |
| 2014 | $1,984 | $17,235 | $10,341 | $6,894 |
Source: Public Records
Map
Nearby Homes
- 116-40 203rd St
- 117-02 202nd St
- 115-69 203rd St
- 117-31 202nd St
- 118 ave 202 St
- 116-32 205th St
- 116-30 205th St
- 118-15 203rd St
- 118-22 201st
- 118-27 201st St
- 205-26 116th Rd
- 118-28 204th St
- 115-47 199th St
- 20516 115th Dr
- 19815 118th Ave
- 11467 202nd St
- 115-47 205 St
- 118-32 200th St
- 114-62 203rd St
- 11812 Francis Lewis Blvd
- 11629 202nd St
- 11635 202nd St
- 116-35 202nd St
- 11627 202nd St
- 11639 202nd St
- 11627 202 Nd St Unit HOUSE
- 11627 202 Nd St
- 116-27 202nd St
- 116-27 202nd St Unit HOUSE
- 11623 202nd St
- 11634 203rd St
- 11636 203rd St
- 11630 203rd St
- 11628 203rd St
- 11640 203rd St
- 11621 202nd St
- 11636 203rd St
- 11636 203rd St Unit 2
- 11636 203rd St Unit 1
- 20207 Linden Blvd