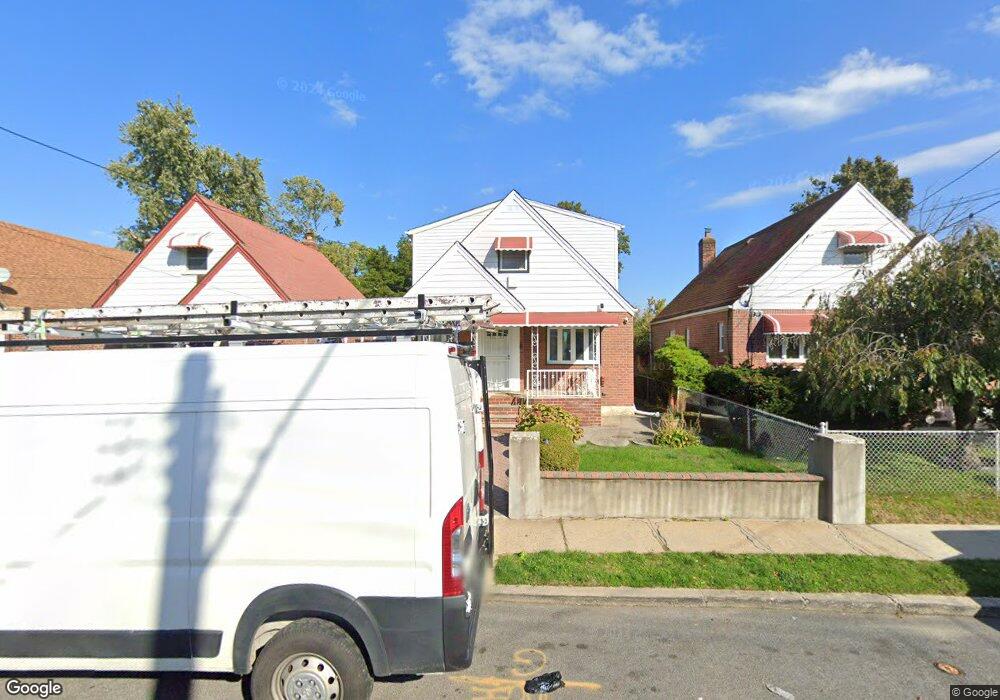
11639 196th St Saint Albans, NY 11412
Saint Albans NeighborhoodEstimated Value: $648,000 - $733,000
--
Bed
--
Bath
1,094
Sq Ft
$636/Sq Ft
Est. Value
About This Home
This home is located at 11639 196th St, Saint Albans, NY 11412 and is currently estimated at $696,002, approximately $636 per square foot. 11639 196th St is a home located in Queens County with nearby schools including P.S. 136 Roy Wilkins, I.S. 192 The Linden, and Riverton Street Charter School.
Ownership History
Date
Name
Owned For
Owner Type
Purchase Details
Closed on
Sep 27, 2024
Sold by
Diouf Amadou and Wone Marieme
Bought by
Wone Marieme
Current Estimated Value
Purchase Details
Closed on
Jun 8, 2009
Sold by
Rockaway Storage Inc
Bought by
Diouf Amadou and Wone Marieme
Home Financials for this Owner
Home Financials are based on the most recent Mortgage that was taken out on this home.
Original Mortgage
$369,000
Outstanding Balance
$235,019
Interest Rate
4.92%
Mortgage Type
Purchase Money Mortgage
Estimated Equity
$460,983
Purchase Details
Closed on
Aug 17, 2005
Sold by
Sidoti Esq As Referee Gregg
Bought by
Rockaway Storage Inc
Purchase Details
Closed on
Aug 13, 1996
Sold by
Rincon Jose and Rincon Ana
Bought by
Fair Kevin E and Grant Heather
Home Financials for this Owner
Home Financials are based on the most recent Mortgage that was taken out on this home.
Original Mortgage
$155,400
Interest Rate
7.83%
Create a Home Valuation Report for This Property
The Home Valuation Report is an in-depth analysis detailing your home's value as well as a comparison with similar homes in the area
Home Values in the Area
Average Home Value in this Area
Purchase History
| Date | Buyer | Sale Price | Title Company |
|---|---|---|---|
| Wone Marieme | -- | -- | |
| Diouf Amadou | $369,000 | -- | |
| Diouf Amadou | $369,000 | -- | |
| Rockaway Storage Inc | $335,000 | -- | |
| Rockaway Storage Inc | $335,000 | -- | |
| Fair Kevin E | $159,000 | Commonwealth Land Title Ins | |
| Fair Kevin E | $159,000 | Commonwealth Land Title Ins |
Source: Public Records
Mortgage History
| Date | Status | Borrower | Loan Amount |
|---|---|---|---|
| Open | Diouf Amadou | $369,000 | |
| Closed | Diouf Amadou | $369,000 | |
| Previous Owner | Fair Kevin E | $155,400 |
Source: Public Records
Tax History Compared to Growth
Tax History
| Year | Tax Paid | Tax Assessment Tax Assessment Total Assessment is a certain percentage of the fair market value that is determined by local assessors to be the total taxable value of land and additions on the property. | Land | Improvement |
|---|---|---|---|---|
| 2025 | $6,158 | $30,896 | $10,968 | $19,928 |
| 2024 | $6,158 | $30,662 | $12,008 | $18,654 |
| 2023 | $5,810 | $28,927 | $10,025 | $18,902 |
| 2022 | $5,448 | $39,840 | $15,720 | $24,120 |
| 2021 | $5,418 | $37,740 | $15,720 | $22,020 |
| 2020 | $5,450 | $32,460 | $15,720 | $16,740 |
| 2019 | $5,345 | $32,220 | $15,720 | $16,500 |
| 2018 | $4,914 | $24,106 | $14,552 | $9,554 |
| 2017 | $4,636 | $22,742 | $13,793 | $8,949 |
| 2016 | $4,289 | $22,742 | $13,793 | $8,949 |
| 2015 | $2,588 | $21,456 | $14,740 | $6,716 |
| 2014 | $2,588 | $21,294 | $12,421 | $8,873 |
Source: Public Records
Map
Nearby Homes
- 116-42 196th St
- 11608 196th St
- 197-13 118th Ave
- 197-20 118th Ave
- 19705 116th Ave
- 192-23 116th Rd
- 115-37 197th St
- 116-39 192nd St
- 194-34 115th Rd
- 191-68 115th Rd
- 194-19 115th Rd
- 115-47 199th St
- 118-32 200th St
- 194-40 115th Ave
- 11516 199th St
- 193-06 119th Ave
- 11932 197th St
- 118-27 201st St
- 114-64 198th St
- 118-29 191st St
- 11643 196th St
- 11635 196th St
- 11631 196th St
- 19619 Linden Blvd
- 11627 196th St
- 19603 Linden Blvd
- 19623 Linden Blvd
- 19607 Linden Blvd
- 19615 Linden Blvd
- 19611 Linden Blvd
- 196-01 Linden Blvd Unit 1
- 19601 Linden Blvd
- 11638 197th St
- 11640 197th St
- 11636 197th St
- 11634 197th St
- 116-23 196th St
- 116-30 197th St
- 19627 Linden Blvd
- 11623 196th St