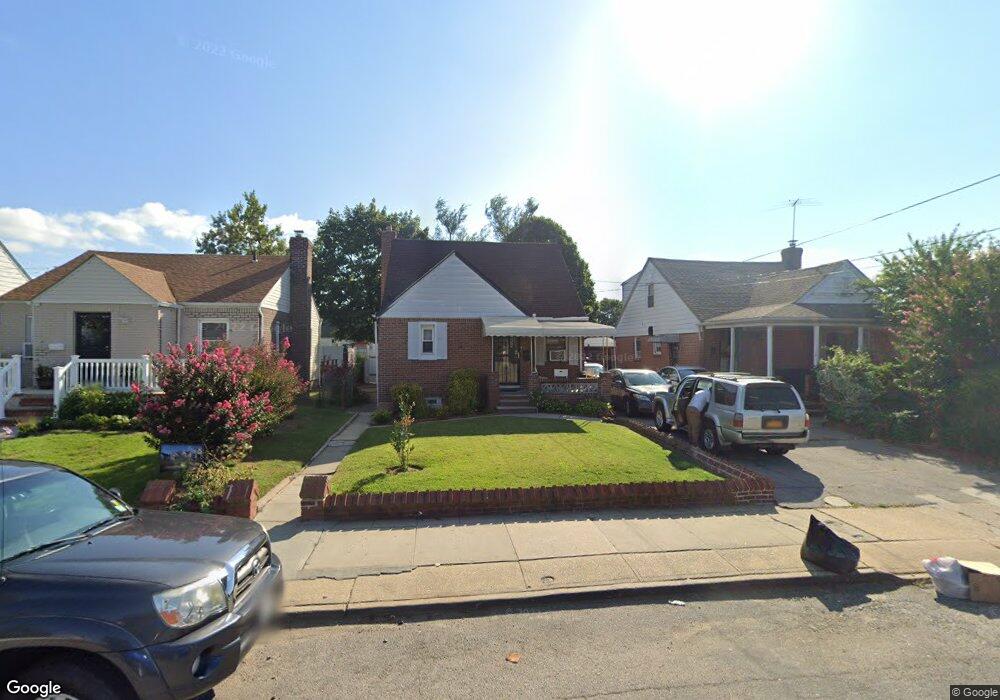
11639 237th St Elmont, NY 11003
Estimated Value: $659,000 - $697,000
3
Beds
2
Baths
1,147
Sq Ft
$593/Sq Ft
Est. Value
About This Home
This home is located at 11639 237th St, Elmont, NY 11003 and is currently estimated at $679,847, approximately $592 per square foot. 11639 237th St is a home located in Nassau County with nearby schools including Cambria Center For The Gifted Child, Word Christian Academy, and Martin De Porres School.
Ownership History
Date
Name
Owned For
Owner Type
Purchase Details
Closed on
Apr 11, 2025
Sold by
Derival Antonio and Derival Marie
Bought by
Derival Antonio and Derival Marie
Current Estimated Value
Purchase Details
Closed on
Jan 22, 2016
Sold by
Christopher Enterprise Inc
Bought by
Derival Antonio and Derival Marie
Home Financials for this Owner
Home Financials are based on the most recent Mortgage that was taken out on this home.
Original Mortgage
$357,142
Outstanding Balance
$287,328
Interest Rate
4.4%
Mortgage Type
FHA
Estimated Equity
$392,519
Purchase Details
Closed on
Dec 7, 2006
Sold by
Retto Gregoria
Bought by
Pichardo Amneris
Purchase Details
Closed on
Aug 19, 2005
Sold by
Persaud Mukesh
Purchase Details
Closed on
Jan 18, 2005
Sold by
Theodule Marc
Bought by
Persaud Mukesh
Purchase Details
Closed on
Sep 1, 2000
Create a Home Valuation Report for This Property
The Home Valuation Report is an in-depth analysis detailing your home's value as well as a comparison with similar homes in the area
Home Values in the Area
Average Home Value in this Area
Purchase History
| Date | Buyer | Sale Price | Title Company |
|---|---|---|---|
| Derival Antonio | -- | Multiple | |
| Derival Antonio | $390,000 | Fidelity National Title Ins | |
| Derival Antonio | $390,000 | Fidelity National Title Ins | |
| Derival Antonio | $390,000 | Fidelity National Title Ins | |
| Pichardo Amneris | $510,000 | -- | |
| Pichardo Amneris | $510,000 | -- | |
| -- | $424,700 | -- | |
| -- | $424,700 | -- | |
| Persaud Mukesh | $337,000 | -- | |
| Persaud Mukesh | $337,000 | -- | |
| -- | -- | -- | |
| -- | -- | -- |
Source: Public Records
Mortgage History
| Date | Status | Borrower | Loan Amount |
|---|---|---|---|
| Open | Derival Antonio | $357,142 | |
| Closed | Derival Antonio | $357,142 |
Source: Public Records
Tax History Compared to Growth
Tax History
| Year | Tax Paid | Tax Assessment Tax Assessment Total Assessment is a certain percentage of the fair market value that is determined by local assessors to be the total taxable value of land and additions on the property. | Land | Improvement |
|---|---|---|---|---|
| 2025 | $10,989 | $433 | $205 | $228 |
| 2024 | $3,521 | $433 | $205 | $228 |
| 2023 | $10,098 | $433 | $205 | $228 |
| 2022 | $10,098 | $433 | $205 | $228 |
| 2021 | $13,240 | $414 | $196 | $218 |
| 2020 | $10,063 | $554 | $528 | $26 |
| 2019 | $9,206 | $554 | $528 | $26 |
| 2017 | $5,332 | $554 | $420 | $134 |
| 2016 | $8,050 | $554 | $420 | $134 |
| 2015 | $3,172 | $696 | $528 | $168 |
| 2014 | $3,172 | $696 | $528 | $168 |
| 2013 | $2,974 | $696 | $528 | $168 |
Source: Public Records
Map
Nearby Homes
- 11624 238th St
- 11582 237th St
- 11619 240th St
- 23319 118th Ave
- 11538 238th St
- 11836 236th St
- 11545 237th St
- 11544 237th St
- 116-67 232nd St
- 11534 237th St
- 11531 237th St
- 115-88 233rd St
- 11543 240th St
- 11919 236th St
- 11651 230th St
- 11418 238th St
- 55 Elizabeth St
- 11504 237th St
- 47 Alden Ave
- 115-70 230th St
- 11639 237th St Unit House
- 11635 237th St
- 11643 237th St
- 11631 237th St
- 11632 238th St
- 11640 238th St
- 11627 237th St
- 11628 238th St
- 1 Landau Ave
- 11646 238th St
- 23709 Linden Blvd
- 23709 Linden Blvd
- 11636 237th St
- 11640 237th St
- 11623 237th St
- 11623 237th St
- 237-17 Linden Blvd
- 11632 237th St
- 11628 237th St
- 116 19 237th St