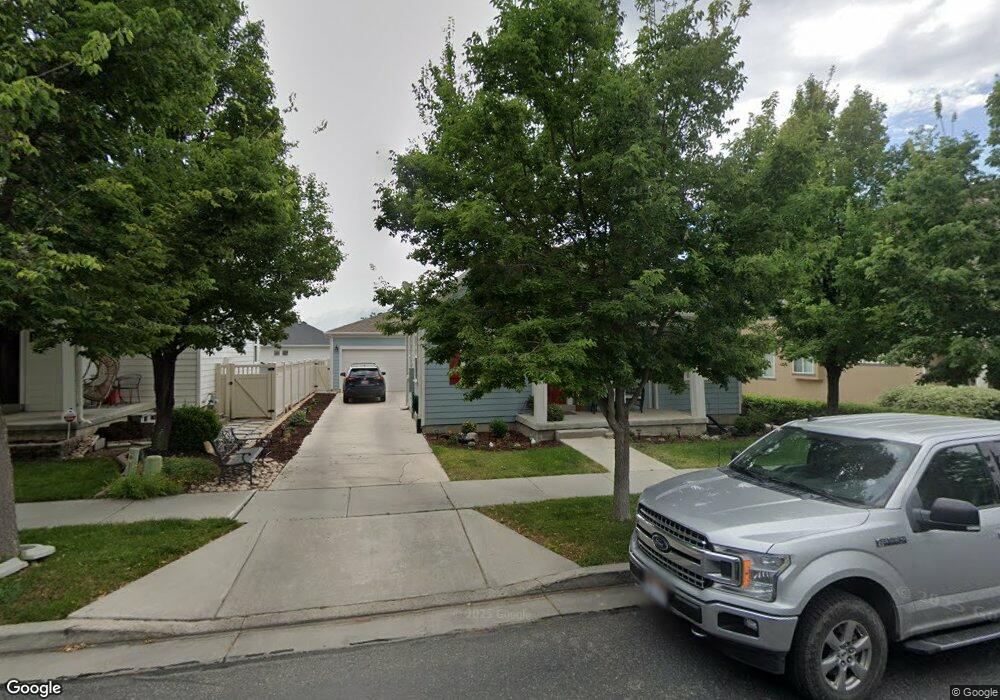
11639 Harvest Crest Way South Jordan, UT 84095
Daybreak NeighborhoodEstimated Value: $543,000 - $635,000
3
Beds
2
Baths
1,622
Sq Ft
$364/Sq Ft
Est. Value
About This Home
This home is located at 11639 Harvest Crest Way, South Jordan, UT 84095 and is currently estimated at $590,436, approximately $364 per square foot. 11639 Harvest Crest Way is a home located in Salt Lake County with nearby schools including Daybreak Elementary School, Mountain Creek Middle School, and Herriman High School.
Ownership History
Date
Name
Owned For
Owner Type
Purchase Details
Closed on
May 10, 2021
Sold by
Hampton Frenchell
Bought by
Hampton Frenchell C
Current Estimated Value
Home Financials for this Owner
Home Financials are based on the most recent Mortgage that was taken out on this home.
Original Mortgage
$291,700
Outstanding Balance
$264,353
Interest Rate
3.1%
Mortgage Type
New Conventional
Estimated Equity
$326,083
Purchase Details
Closed on
Mar 6, 2017
Sold by
Hampton Benjamin M
Bought by
Hampton Frenchell
Purchase Details
Closed on
Aug 8, 2016
Sold by
Margetts Todd P
Bought by
Hampton Benajmin M
Home Financials for this Owner
Home Financials are based on the most recent Mortgage that was taken out on this home.
Original Mortgage
$314,153
Interest Rate
3.25%
Mortgage Type
FHA
Purchase Details
Closed on
Mar 7, 2012
Sold by
The Secretary Of Housing & Urban Develop
Bought by
Margetts Todd P
Home Financials for this Owner
Home Financials are based on the most recent Mortgage that was taken out on this home.
Original Mortgage
$198,000
Interest Rate
3.92%
Mortgage Type
New Conventional
Purchase Details
Closed on
Nov 16, 2011
Sold by
Wells Fargo Bank Na
Bought by
Secretary Of Housing & Urban Development
Purchase Details
Closed on
Sep 28, 2011
Sold by
Elam William R
Bought by
Wells Fargo Bank Na
Purchase Details
Closed on
Jan 25, 2011
Sold by
Elam Erika N
Bought by
Elam William R
Purchase Details
Closed on
Jul 22, 2005
Sold by
Elam William R
Bought by
Elam William R and Elam Erika N
Home Financials for this Owner
Home Financials are based on the most recent Mortgage that was taken out on this home.
Original Mortgage
$227,448
Interest Rate
5.46%
Mortgage Type
FHA
Purchase Details
Closed on
Apr 29, 2005
Sold by
Elam William R
Bought by
Elam William R and Elam Erika N
Home Financials for this Owner
Home Financials are based on the most recent Mortgage that was taken out on this home.
Original Mortgage
$224,482
Interest Rate
5.92%
Mortgage Type
FHA
Purchase Details
Closed on
Apr 28, 2005
Sold by
Richmond American Homes Of Utah Inc
Bought by
Elam William R
Home Financials for this Owner
Home Financials are based on the most recent Mortgage that was taken out on this home.
Original Mortgage
$224,482
Interest Rate
5.92%
Mortgage Type
FHA
Purchase Details
Closed on
Jun 14, 2004
Sold by
Kennecott Land Residential Development C
Bought by
Richmond American Homes Of Utah Inc
Create a Home Valuation Report for This Property
The Home Valuation Report is an in-depth analysis detailing your home's value as well as a comparison with similar homes in the area
Home Values in the Area
Average Home Value in this Area
Purchase History
| Date | Buyer | Sale Price | Title Company |
|---|---|---|---|
| Hampton Frenchell C | -- | Gt Title Services Slc | |
| Hampton Frenchell | -- | Richland Title Ins Agency In | |
| Hampton Benajmin M | -- | Richland Title Ins Agency In | |
| Margetts Todd P | -- | Monument Title Ins Co | |
| Secretary Of Housing & Urban Development | -- | Backman Title Services | |
| Wells Fargo Bank Na | $223,967 | Etitle Insurance Agency | |
| Elam William R | -- | None Available | |
| Elam William R | -- | Deer Creek Title Ins Inc | |
| Elam William R | -- | Deer Creek Title Ins Inc | |
| Elam William R | -- | First American Title | |
| Elam William R | -- | First American Title | |
| Richmond American Homes Of Utah Inc | -- | First American Title |
Source: Public Records
Mortgage History
| Date | Status | Borrower | Loan Amount |
|---|---|---|---|
| Open | Hampton Frenchell C | $291,700 | |
| Closed | Hampton Benajmin M | $314,153 | |
| Previous Owner | Margetts Todd P | $198,000 | |
| Previous Owner | Elam William R | $227,448 | |
| Previous Owner | Elam William R | $224,482 |
Source: Public Records
Tax History Compared to Growth
Tax History
| Year | Tax Paid | Tax Assessment Tax Assessment Total Assessment is a certain percentage of the fair market value that is determined by local assessors to be the total taxable value of land and additions on the property. | Land | Improvement |
|---|---|---|---|---|
| 2025 | $2,846 | $546,800 | $100,800 | $446,000 |
| 2024 | $2,846 | $540,400 | $97,800 | $442,600 |
| 2023 | $2,961 | $530,500 | $95,000 | $435,500 |
| 2022 | $3,052 | $535,900 | $93,200 | $442,700 |
| 2021 | $2,429 | $391,300 | $71,800 | $319,500 |
| 2020 | $2,381 | $359,600 | $67,600 | $292,000 |
| 2019 | $2,371 | $352,000 | $67,600 | $284,400 |
| 2018 | $2,251 | $332,400 | $67,100 | $265,300 |
| 2017 | $2,164 | $313,200 | $67,100 | $246,100 |
| 2016 | $2,114 | $290,000 | $63,700 | $226,300 |
| 2015 | $2,114 | $281,900 | $77,800 | $204,100 |
| 2014 | $2,002 | $262,400 | $87,700 | $174,700 |
Source: Public Records
Map
Nearby Homes
- 4463 W Harvest Sun Ln
- 11491 Harvest Crest Way
- 4454 W 11800 S
- 4466 W 11800 S
- 4347 W 11770 S
- 4536 W Silent Rain Dr
- 4555 W Open Hill Dr
- 11777 S 4210 W
- 11347 S Kestrel Rise Rd
- 4144 W Foxview Dr
- 11768 S Copper Sky Dr
- 4491 W Daybreak Rim Way
- 11429 S Oakmond Rd
- 11381 Skylux Ave
- 4629 W Daybreak Rim Way
- 11411 S Oakmond Rd
- 11915 Goldsmith Ct
- 4586 W Daybreak Rim Way Unit 396
- 4584 W Daybreak Rim Way
- 4774 W Daybreak Rim Way
- 11639 S Harvest Crest Way
- 11647 Harvest Crest Way
- 11631 Harvest Crest Way
- 11647 S Harvest Crest Way
- 11647 S Harvest Way W
- 11644 S Harvest Rain Ave
- 11644 Harvest Rain Ave
- 11632 S Harvest Rain Ave
- 11632 Harvest Rain Ave
- 11657 Harvest Crest Way
- 11621 Harvest Crest Way
- 11654 Harvest Rain Ave
- 11654 S Harvest Rain Ave
- 11638 S Harvest Crest Way
- 11638 Harvest Crest Way
- 11646 Harvest Crest Way
- 11622 S Harvest Rain Ave
- 11622 Harvest Rain Ave
- 11628 S Harvest Crest Way
- 11628 Harvest Crest Way