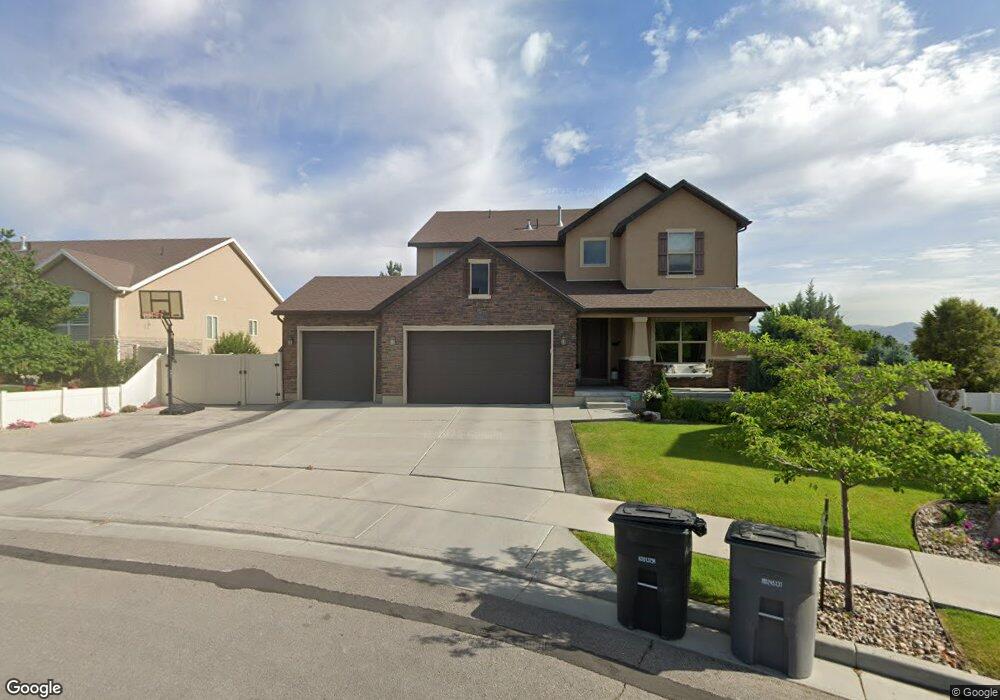
1164 Le Rosier Ct West Jordan, UT 84088
Estimated Value: $593,000 - $652,000
3
Beds
3
Baths
2,670
Sq Ft
$232/Sq Ft
Est. Value
About This Home
This home is located at 1164 Le Rosier Ct, West Jordan, UT 84088 and is currently estimated at $618,776, approximately $231 per square foot. 1164 Le Rosier Ct is a home located in Salt Lake County with nearby schools including Riverside Elementary School, West Jordan Middle School, and West Jordan High School.
Ownership History
Date
Name
Owned For
Owner Type
Purchase Details
Closed on
Jul 8, 2024
Sold by
Bohn Jason W and Sandos Heather
Bought by
Nelson Jacob
Current Estimated Value
Home Financials for this Owner
Home Financials are based on the most recent Mortgage that was taken out on this home.
Original Mortgage
$510,000
Outstanding Balance
$503,850
Interest Rate
6.94%
Mortgage Type
New Conventional
Estimated Equity
$114,926
Purchase Details
Closed on
Jun 27, 2024
Sold by
Bohn Jason W and Sandos Heather
Bought by
Nelson Jacob
Home Financials for this Owner
Home Financials are based on the most recent Mortgage that was taken out on this home.
Original Mortgage
$510,000
Outstanding Balance
$503,850
Interest Rate
6.94%
Mortgage Type
New Conventional
Estimated Equity
$114,926
Purchase Details
Closed on
Feb 28, 2024
Sold by
Rochelle G Bohn Family Trust
Bought by
Bohn Jason W and Sandos Heather
Purchase Details
Closed on
Nov 30, 2023
Sold by
Bohn Rochelle G
Bought by
Rochelle G Bohn Family Trust and Bohn
Purchase Details
Closed on
Nov 20, 2015
Sold by
Bohn Rochelle G
Bought by
Bohn Rochelle G
Home Financials for this Owner
Home Financials are based on the most recent Mortgage that was taken out on this home.
Original Mortgage
$260,000
Interest Rate
3.71%
Mortgage Type
New Conventional
Purchase Details
Closed on
Oct 28, 2009
Sold by
Bohn Rochelle
Bought by
Bohn Rochelle G
Home Financials for this Owner
Home Financials are based on the most recent Mortgage that was taken out on this home.
Original Mortgage
$224,000
Interest Rate
4.5%
Mortgage Type
New Conventional
Purchase Details
Closed on
Apr 7, 2006
Sold by
Elder Sandra M and Andrews Sherleen M
Bought by
Bohn Rochelle
Home Financials for this Owner
Home Financials are based on the most recent Mortgage that was taken out on this home.
Original Mortgage
$192,000
Interest Rate
6.12%
Mortgage Type
Purchase Money Mortgage
Purchase Details
Closed on
Nov 18, 2004
Sold by
Elder Sandra M
Bought by
Elder Sandra M and Andrews Sherleen M
Home Financials for this Owner
Home Financials are based on the most recent Mortgage that was taken out on this home.
Original Mortgage
$176,500
Interest Rate
1%
Mortgage Type
Purchase Money Mortgage
Purchase Details
Closed on
Oct 22, 2004
Sold by
Andrews Sherleen M
Bought by
Elder Sandra M
Home Financials for this Owner
Home Financials are based on the most recent Mortgage that was taken out on this home.
Original Mortgage
$176,500
Interest Rate
1%
Mortgage Type
Purchase Money Mortgage
Purchase Details
Closed on
Jan 31, 2003
Sold by
Village Communities Lc
Bought by
Elder Sandra M and Andrews Sherleen M
Home Financials for this Owner
Home Financials are based on the most recent Mortgage that was taken out on this home.
Original Mortgage
$118,450
Interest Rate
5.78%
Create a Home Valuation Report for This Property
The Home Valuation Report is an in-depth analysis detailing your home's value as well as a comparison with similar homes in the area
Home Values in the Area
Average Home Value in this Area
Purchase History
| Date | Buyer | Sale Price | Title Company |
|---|---|---|---|
| Nelson Jacob | -- | Sutherland Title Company | |
| Nelson Jacob | -- | Sutherland Title Company | |
| Bohn Jason W | -- | None Listed On Document | |
| Rochelle G Bohn Family Trust | -- | None Listed On Document | |
| Bohn Rochelle G | -- | Magellan Title | |
| Bohn Rochelle G | -- | First American Title | |
| Bohn Rochelle | -- | First American Title Ut Co | |
| Elder Sandra M | -- | United Title Services | |
| Elder Sandra M | -- | United Title Services | |
| Elder Sandra M | -- | Guardian Title |
Source: Public Records
Mortgage History
| Date | Status | Borrower | Loan Amount |
|---|---|---|---|
| Open | Nelson Jacob | $510,000 | |
| Closed | Nelson Jacob | $510,000 | |
| Previous Owner | Bohn Rochelle G | $260,000 | |
| Previous Owner | Bohn Rochelle G | $224,000 | |
| Previous Owner | Bohn Rochelle | $192,000 | |
| Previous Owner | Elder Sandra M | $176,500 | |
| Previous Owner | Elder Sandra M | $118,450 |
Source: Public Records
Tax History Compared to Growth
Tax History
| Year | Tax Paid | Tax Assessment Tax Assessment Total Assessment is a certain percentage of the fair market value that is determined by local assessors to be the total taxable value of land and additions on the property. | Land | Improvement |
|---|---|---|---|---|
| 2025 | $2,909 | $614,500 | $117,600 | $496,900 |
| 2024 | $2,909 | $548,800 | $114,500 | $434,300 |
| 2023 | $2,983 | $530,600 | $137,400 | $393,200 |
| 2022 | $3,034 | $530,800 | $134,700 | $396,100 |
| 2021 | $2,644 | $420,000 | $108,100 | $311,900 |
| 2020 | $2,526 | $376,400 | $103,000 | $273,400 |
| 2019 | $2,517 | $367,700 | $97,200 | $270,500 |
| 2018 | $2,437 | $352,700 | $97,200 | $255,500 |
| 2017 | $2,213 | $318,400 | $97,200 | $221,200 |
| 2016 | $2,300 | $311,100 | $101,900 | $209,200 |
| 2015 | $2,351 | $309,700 | $108,700 | $201,000 |
| 2014 | $2,264 | $293,400 | $103,800 | $189,600 |
Source: Public Records
Map
Nearby Homes
- 9297 S Avignon Place
- 1116 W 9440 S
- 1184 W Michaelsen Way
- 9095 S 1150 W
- 8686 S Temple Dr
- 9121 S Hidden Peak Dr
- 9141 S Little Creek Dr
- 9532 S Willow Trail Way
- 8976 S 1050 W
- 9332 S Chartres Ave
- 885 W Chartres Ave
- 8843 Capernaum Rd
- 8772 S Midvalley Dr
- 1424 Stone Meadow Dr
- 9837 Jordan Ridge Rd
- 1352 W 8780 S
- 9635 S 1600 W
- 8713 Mountain Meadow Dr
- 9847 S Castello Ct Unit 5
- 9847 S 1000 W
- 1164 W Le Rosier Ct
- 1164 W Le Rosier Ct Unit 22
- 1158 Le Rosier Ct Unit COM
- 1168 W Le Rosier Ct
- 1168 Le Rosier Ct
- 1152 Le Rosier Ct
- 1174 Le Rosier Ct
- 1157 Le Rosier Ct
- 1174 W Le Rosier Ct
- 1157 W Le Rosier Ct
- 9273 Le Rosier Ct
- 9273 S Le Rosier Ct
- 1151 W Le Rosier Ct
- 1151 Le Rosier Ct
- 1148 Le Rosier Ct
- 1162 W Windmill Hill Way
- 1170 W Windmill Hill Way
- 1153 Trimble Creek Dr
- 9302 S Avignon Place
- 9302 Avignon Place