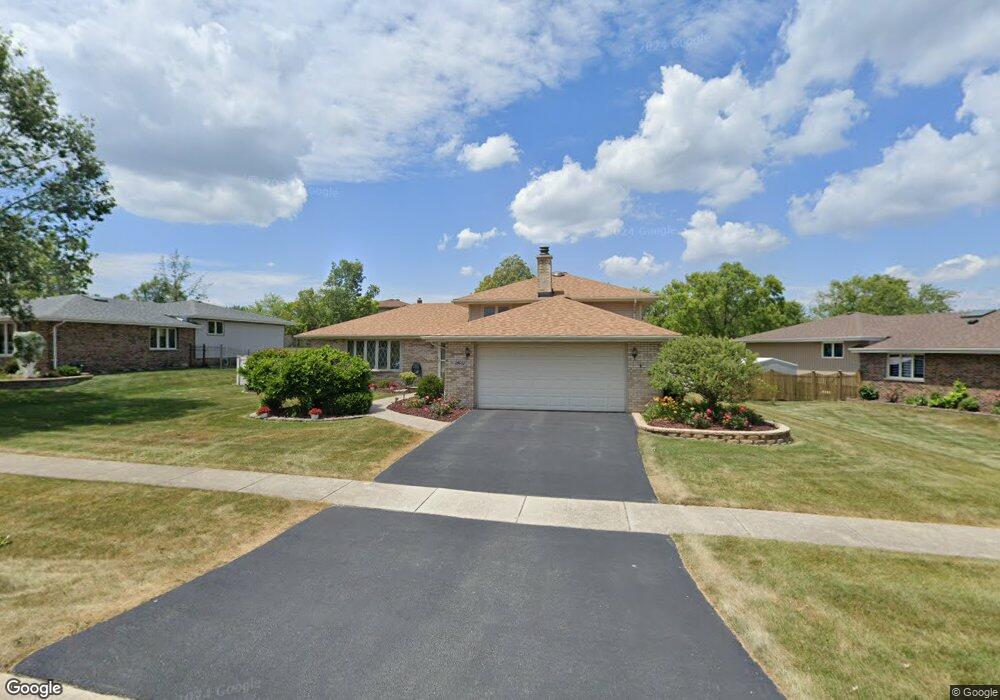
11641 Brookview Ln Orland Park, IL 60467
Orland Grove NeighborhoodEstimated Value: $407,081 - $475,000
3
Beds
2
Baths
1,504
Sq Ft
$299/Sq Ft
Est. Value
About This Home
This home is located at 11641 Brookview Ln, Orland Park, IL 60467 and is currently estimated at $449,520, approximately $298 per square foot. 11641 Brookview Ln is a home located in Cook County with nearby schools including Orland Park Elementary School, High Point Elementary School, and Orland Jr High School.
Ownership History
Date
Name
Owned For
Owner Type
Purchase Details
Closed on
Sep 9, 2020
Sold by
Volin Frank E and Volin Margaret A
Bought by
Volin Frank E and Volin Margaret A
Current Estimated Value
Purchase Details
Closed on
Jul 18, 2008
Sold by
Wells Fargo Bank Na
Bought by
Saenz Luis B
Home Financials for this Owner
Home Financials are based on the most recent Mortgage that was taken out on this home.
Original Mortgage
$112,955
Outstanding Balance
$73,104
Interest Rate
6.39%
Mortgage Type
Unknown
Estimated Equity
$376,416
Purchase Details
Closed on
Oct 17, 2007
Sold by
Zambrano Heriberto
Bought by
Wells Fargo Bank Na
Purchase Details
Closed on
Aug 18, 1994
Sold by
Nicosia Antonino and Nicosia Patrizia
Bought by
Volin Frank E and Volin Margaret A
Home Financials for this Owner
Home Financials are based on the most recent Mortgage that was taken out on this home.
Original Mortgage
$80,000
Interest Rate
8.73%
Create a Home Valuation Report for This Property
The Home Valuation Report is an in-depth analysis detailing your home's value as well as a comparison with similar homes in the area
Home Values in the Area
Average Home Value in this Area
Purchase History
| Date | Buyer | Sale Price | Title Company |
|---|---|---|---|
| Volin Frank E | -- | Attorney | |
| Saenz Luis B | $119,000 | None Available | |
| Wells Fargo Bank Na | -- | None Available | |
| Volin Frank E | $180,000 | Intercounty Title |
Source: Public Records
Mortgage History
| Date | Status | Borrower | Loan Amount |
|---|---|---|---|
| Open | Saenz Luis B | $112,955 | |
| Previous Owner | Volin Frank E | $80,000 |
Source: Public Records
Tax History
| Year | Tax Paid | Tax Assessment Tax Assessment Total Assessment is a certain percentage of the fair market value that is determined by local assessors to be the total taxable value of land and additions on the property. | Land | Improvement |
|---|---|---|---|---|
| 2025 | $7,574 | $36,319 | $6,313 | $30,006 |
| 2024 | $7,574 | $36,319 | $6,313 | $30,006 |
| 2023 | $5,506 | $39,001 | $6,313 | $32,688 |
| 2022 | $5,506 | $26,340 | $5,555 | $20,785 |
| 2021 | $5,325 | $26,340 | $5,555 | $20,785 |
| 2020 | $5,896 | $28,894 | $5,555 | $23,339 |
| 2019 | $4,671 | $24,978 | $5,050 | $19,928 |
| 2018 | $3,350 | $24,978 | $5,050 | $19,928 |
| 2017 | $3,204 | $24,978 | $5,050 | $19,928 |
| 2016 | $4,155 | $20,878 | $4,545 | $16,333 |
| 2015 | $4,060 | $20,878 | $4,545 | $16,333 |
| 2014 | $5,097 | $20,878 | $4,545 | $16,333 |
| 2013 | $4,338 | $23,345 | $4,545 | $18,800 |
Source: Public Records
Map
Nearby Homes
- 14328 Pinewood Dr
- 11901 Windemere Ct Unit 301
- 14170 Green Valley Dr
- 11904 Somerset Rd
- 109 Singletree Rd Unit 3
- 11150 Alexis Ln
- 11132 Alexis Ln
- 14433 Mallard Dr
- 11708 139th St
- 9 Silo Ridge Rd W
- 14010 Hialeah Ct
- 13821 116th Ave
- 13929 Fermoy Ave
- 11024 Marilyn Terrace
- 15220 Arbor Dr
- 14340 108th Ave
- 14237 Ashford Ct
- 14700 108th Ave
- 15022 S Woodcrest Ave Unit 3
- 10801 Doyle Ct
- 11639 Brookview Ln
- 11645 Brookview Ln
- 14415 Pineview Ct
- 14421 Pineview Ct
- 11647 Brookview Ln
- 11640 Brookview Ln
- 11642 Brookview Ln
- 11638 Brookview Ln
- 14427 Pineview Ct
- 11644 Brookview Ln
- 11701 Brookview Ln
- 14412 Pineview Ct
- 11635 Brookview Ln
- 11636 Brookview Ln
- 11646 Brookview Ln
- 14439 Pineview Ct
- 11709 Brookview Ln
- 11634 Brookview Ln
- 11654 Brookview Ln
- 14416 Pineview Ct
Your Personal Tour Guide
Ask me questions while you tour the home.