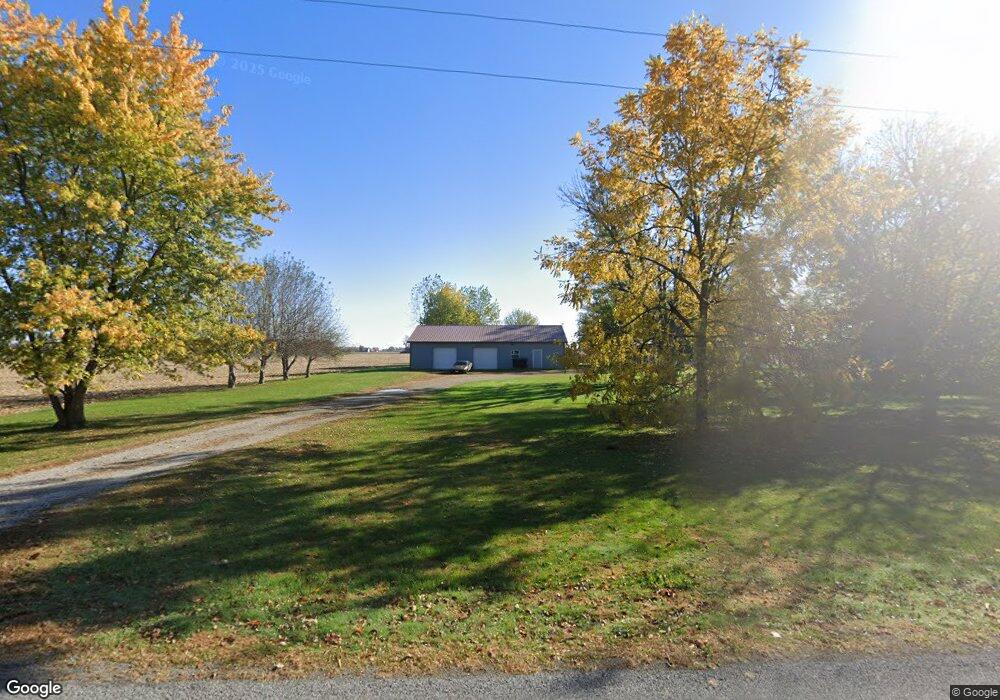
11642 Aqueduct Rd Saint Marys, OH 45885
Estimated Value: $288,986 - $591,000
3
Beds
1
Bath
2,856
Sq Ft
$144/Sq Ft
Est. Value
About This Home
This home is located at 11642 Aqueduct Rd, Saint Marys, OH 45885 and is currently estimated at $412,247, approximately $144 per square foot. 11642 Aqueduct Rd is a home located in Auglaize County with nearby schools including St. Mary's West Intermediate School, St. Mary's East Primary School, and St. Marys Middle School.
Ownership History
Date
Name
Owned For
Owner Type
Purchase Details
Closed on
Sep 9, 2016
Sold by
Keiber Kathleen M
Bought by
Keiber Timothy L
Current Estimated Value
Home Financials for this Owner
Home Financials are based on the most recent Mortgage that was taken out on this home.
Original Mortgage
$110,000
Outstanding Balance
$50,962
Interest Rate
3.48%
Mortgage Type
New Conventional
Estimated Equity
$361,285
Purchase Details
Closed on
Jul 9, 1999
Sold by
Keiber Timothy L and Keiber Kathleen M
Bought by
Keiber Timothy L and Keiber Kathleen M
Purchase Details
Closed on
Feb 3, 1999
Sold by
Wierwille Virgil Edward
Bought by
Keiber Timothy L
Purchase Details
Closed on
Jul 19, 1990
Sold by
Wierwille Virgil Edward
Bought by
Wierwille Virgil Edward
Create a Home Valuation Report for This Property
The Home Valuation Report is an in-depth analysis detailing your home's value as well as a comparison with similar homes in the area
Home Values in the Area
Average Home Value in this Area
Purchase History
| Date | Buyer | Sale Price | Title Company |
|---|---|---|---|
| Keiber Timothy L | -- | Tenure Title Agency | |
| Keiber Timothy L | $30,000 | -- | |
| Keiber Timothy L | -- | -- | |
| Wierwille Virgil Edward | $30,000 | -- |
Source: Public Records
Mortgage History
| Date | Status | Borrower | Loan Amount |
|---|---|---|---|
| Open | Keiber Timothy L | $110,000 |
Source: Public Records
Tax History Compared to Growth
Tax History
| Year | Tax Paid | Tax Assessment Tax Assessment Total Assessment is a certain percentage of the fair market value that is determined by local assessors to be the total taxable value of land and additions on the property. | Land | Improvement |
|---|---|---|---|---|
| 2024 | $4,640 | $60,700 | $12,360 | $48,340 |
| 2023 | $2,288 | $60,700 | $12,360 | $48,340 |
| 2022 | $2,176 | $51,240 | $10,960 | $40,280 |
| 2021 | $2,157 | $51,240 | $10,960 | $40,280 |
| 2020 | $2,160 | $51,233 | $10,955 | $40,278 |
| 2019 | $1,873 | $42,742 | $9,128 | $33,614 |
| 2018 | $1,873 | $42,742 | $9,128 | $33,614 |
| 2017 | $1,875 | $42,742 | $9,128 | $33,614 |
| 2016 | $1,845 | $42,175 | $8,694 | $33,481 |
| 2015 | $1,805 | $42,175 | $8,694 | $33,481 |
| 2014 | $1,816 | $42,175 | $8,694 | $33,481 |
| 2013 | $1,892 | $42,175 | $8,694 | $33,481 |
Source: Public Records
Map
Nearby Homes
- 437 Woodward St
- 0 S Beech St
- 602 Weston St
- 508 Webb St
- 403 S Vine St
- 408 S Vine St
- 216 Beech St
- 405 E Spring St
- 428 W Spring St
- 125 Beech St
- 105 Maple St
- 134 N Front St
- 1015 Columbia St
- 811 Columbia St
- 220 N Augustus St
- 712 Columbia St
- 200 N Knoxville Ave Unit 7
- 911 Cleveland Ave
- 706 Jackson St
- 313 Concord Ave
- 04092 Quellhorst Rd
- 04030 Quellhorst Rd
- 11841 Aqueduct Rd
- 11375 State Route 66
- 11389 State Route 66
- 11333 State Route 66
- 04561 Aqueduct Rd
- 03909 Koop Rd
- 11331 State Route 66
- 12127 Aqueduct Rd
- 04609 Aqueduct Rd
- 11212 State Route 66
- 11162 State Route 66
- 12027 State Route 66
- 12088 State Route 66
- 12132 Aqueduct Rd
- 12039 State Route 66
- 12029 State Route 66
- 11072 State Route 66
- 12129 Aqueduct Rd