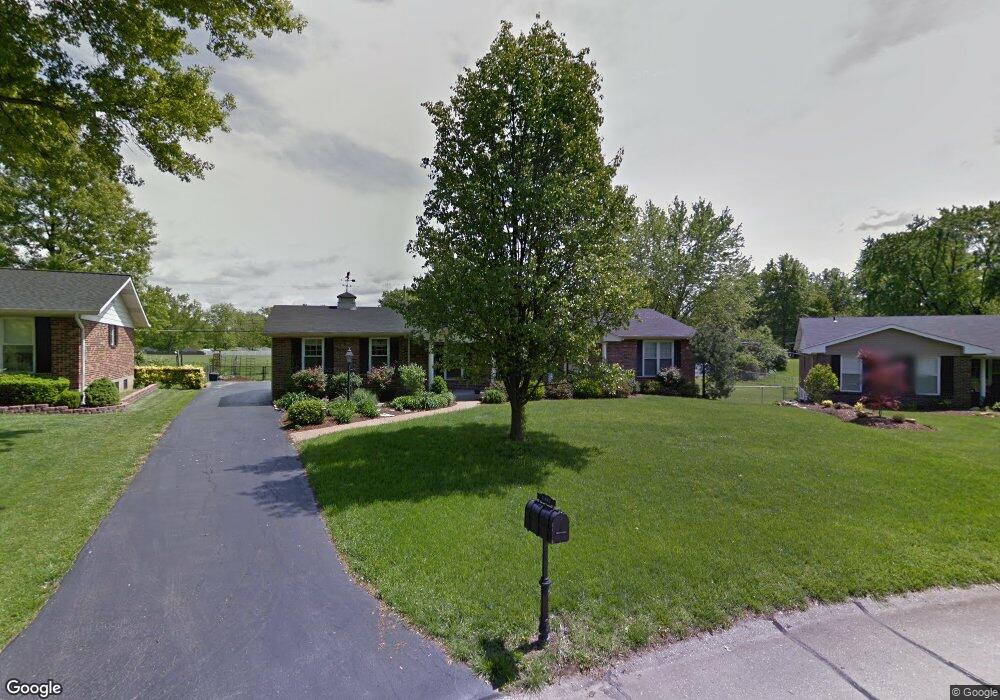
11642 Rossmoor Ln Saint Louis, MO 63128
Estimated Value: $337,816 - $376,000
3
Beds
2
Baths
1,440
Sq Ft
$249/Sq Ft
Est. Value
About This Home
This home is located at 11642 Rossmoor Ln, Saint Louis, MO 63128 and is currently estimated at $358,954, approximately $249 per square foot. 11642 Rossmoor Ln is a home located in St. Louis County with nearby schools including Sappington Elementary School, Sperreng Middle School, and Lindbergh High School.
Ownership History
Date
Name
Owned For
Owner Type
Purchase Details
Closed on
Aug 12, 2021
Sold by
Higgins John G and Higgins Marilyn Ann
Bought by
Higgins John G and Higgins Marilyn Ann
Current Estimated Value
Purchase Details
Closed on
Dec 3, 2009
Sold by
Stamm Kathleen M
Bought by
Higgins John G and Higgins Marilyn Ann
Home Financials for this Owner
Home Financials are based on the most recent Mortgage that was taken out on this home.
Original Mortgage
$212,135
Outstanding Balance
$139,498
Interest Rate
5.06%
Mortgage Type
VA
Estimated Equity
$219,456
Purchase Details
Closed on
Nov 9, 2000
Sold by
Watkins Karen J and Kenner Winfred W
Bought by
Stamm Kathleen M
Home Financials for this Owner
Home Financials are based on the most recent Mortgage that was taken out on this home.
Original Mortgage
$95,000
Interest Rate
7.86%
Create a Home Valuation Report for This Property
The Home Valuation Report is an in-depth analysis detailing your home's value as well as a comparison with similar homes in the area
Home Values in the Area
Average Home Value in this Area
Purchase History
| Date | Buyer | Sale Price | Title Company |
|---|---|---|---|
| Higgins John G | -- | None Available | |
| Higgins John G | $220,000 | None Available | |
| Stamm Kathleen M | $160,500 | First American Title | |
| Stamm Kathleen M | -- | First American Title |
Source: Public Records
Mortgage History
| Date | Status | Borrower | Loan Amount |
|---|---|---|---|
| Open | Higgins John G | $212,135 | |
| Previous Owner | Stamm Kathleen M | $95,000 |
Source: Public Records
Tax History Compared to Growth
Tax History
| Year | Tax Paid | Tax Assessment Tax Assessment Total Assessment is a certain percentage of the fair market value that is determined by local assessors to be the total taxable value of land and additions on the property. | Land | Improvement |
|---|---|---|---|---|
| 2025 | $3,467 | $56,910 | $23,220 | $33,690 |
| 2024 | $3,467 | $53,240 | $21,280 | $31,960 |
| 2023 | $3,458 | $53,240 | $21,280 | $31,960 |
| 2022 | $3,123 | $46,110 | $18,180 | $27,930 |
| 2021 | $3,013 | $46,110 | $18,180 | $27,930 |
| 2020 | $3,178 | $46,960 | $17,210 | $29,750 |
| 2019 | $3,170 | $46,960 | $17,210 | $29,750 |
| 2018 | $2,663 | $35,820 | $10,550 | $25,270 |
| 2017 | $2,634 | $35,820 | $10,550 | $25,270 |
| 2016 | $2,547 | $32,880 | $10,550 | $22,330 |
| 2015 | $2,509 | $32,880 | $10,550 | $22,330 |
| 2014 | $2,457 | $31,880 | $8,680 | $23,200 |
Source: Public Records
Map
Nearby Homes
- 11673 Rossmoor Ln
- 5837 Oak Forest Ln
- 11542 Concord Village Ave
- 11345 Revere Ln
- 11862 E Concord Rd
- 25 Fawnwood Dr
- 9932 Jan Dr
- 10923 Suanis Ct
- 12015 Charwick Dr
- 10903 Village Grove Dr Unit D
- 10924 Village Grove Dr Unit C
- 4838 Dorsie Dr
- 10080 Sakura Dr Unit 1
- 10080 Sakura Dr Unit 8
- 10070 Sakura Dr Unit 100070
- 12055 Charwick Dr
- 10916 Arctic Dr
- 10117 Sakura Dr Unit F
- 10835 Mallory Dr
- 10115 Fite Cir
- 11648 Rossmoor Ln
- 11634 Rossmoor Ln
- 11654 Rossmoor Ln
- 11655 Rossmoor Ln
- 11626 Rossmoor Ln
- 9807 Chatsworth Dr
- 9815 Chatsworth Dr
- 11609 Rossmoor Ln
- 11662 Rossmoor Ln
- 9823 Chatsworth Dr
- 11661 Rossmoor Ln
- 9800 Chatsworth Dr
- 11620 Rossmoor Ln
- 11605 Rossmoor Ln
- 11616 Rossmoor Ln
- 11680 Rossmoor Ln
- 9806 Chatsworth Dr
- 11667 Rossmoor Ln
- 9814 Chatsworth Dr
- 11600 Rossmoor Ln