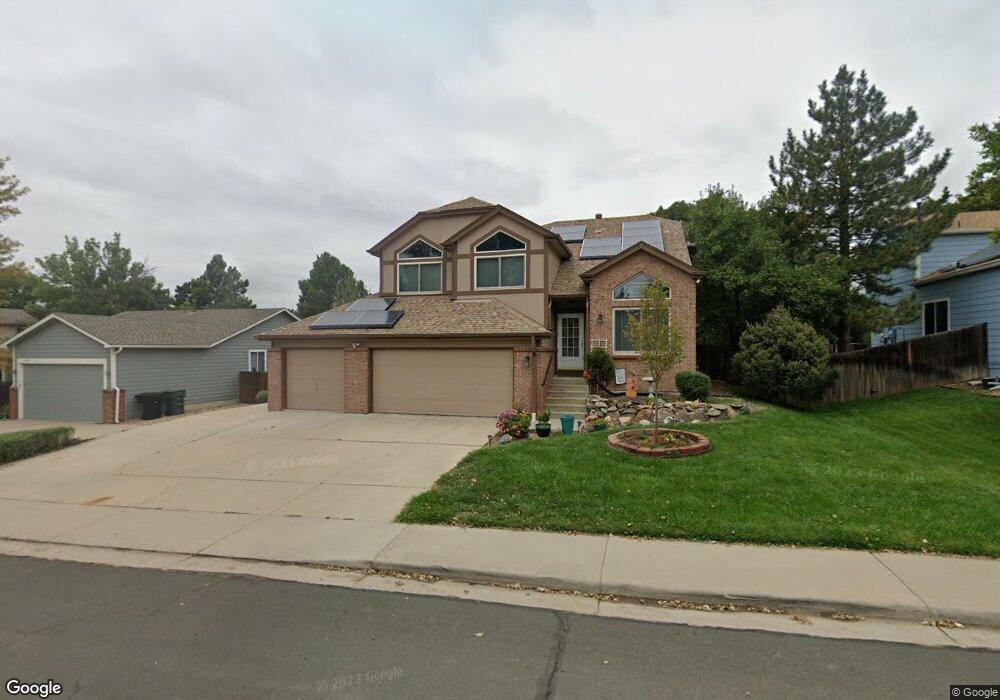
11649 Clayton St Thornton, CO 80233
Estimated Value: $515,788 - $583,000
3
Beds
3
Baths
1,620
Sq Ft
$336/Sq Ft
Est. Value
About This Home
This home is located at 11649 Clayton St, Thornton, CO 80233 and is currently estimated at $544,447, approximately $336 per square foot. 11649 Clayton St is a home located in Adams County with nearby schools including Woodglen Elementary School, Century Middle School, and Mountain Range High School.
Ownership History
Date
Name
Owned For
Owner Type
Purchase Details
Closed on
Nov 13, 2001
Sold by
Sadafi Mahmood
Bought by
Sadafi Matt and Sadafi Vida
Current Estimated Value
Purchase Details
Closed on
Mar 18, 1999
Sold by
Bankston Ronald L and Bankston Omaira J
Bought by
Welch Charles Eric and Welch Karla L
Home Financials for this Owner
Home Financials are based on the most recent Mortgage that was taken out on this home.
Original Mortgage
$178,700
Outstanding Balance
$43,028
Interest Rate
6.69%
Mortgage Type
FHA
Estimated Equity
$501,419
Purchase Details
Closed on
May 22, 1998
Sold by
Sadafi Matt and Sadafi Vida
Bought by
Bankston Ronald L and Bankston Omaira J
Home Financials for this Owner
Home Financials are based on the most recent Mortgage that was taken out on this home.
Original Mortgage
$162,000
Interest Rate
7.22%
Purchase Details
Closed on
Apr 30, 1993
Purchase Details
Closed on
Apr 23, 1992
Create a Home Valuation Report for This Property
The Home Valuation Report is an in-depth analysis detailing your home's value as well as a comparison with similar homes in the area
Home Values in the Area
Average Home Value in this Area
Purchase History
| Date | Buyer | Sale Price | Title Company |
|---|---|---|---|
| Sadafi Matt | -- | -- | |
| Welch Charles Eric | $179,950 | -- | |
| Bankston Ronald L | $180,000 | -- | |
| -- | $117,500 | -- | |
| -- | -- | -- |
Source: Public Records
Mortgage History
| Date | Status | Borrower | Loan Amount |
|---|---|---|---|
| Open | Welch Charles Eric | $178,700 | |
| Previous Owner | Bankston Ronald L | $162,000 |
Source: Public Records
Tax History Compared to Growth
Tax History
| Year | Tax Paid | Tax Assessment Tax Assessment Total Assessment is a certain percentage of the fair market value that is determined by local assessors to be the total taxable value of land and additions on the property. | Land | Improvement |
|---|---|---|---|---|
| 2024 | $3,397 | $31,620 | $6,560 | $25,060 |
| 2023 | $3,362 | $36,530 | $6,560 | $29,970 |
| 2022 | $2,925 | $26,550 | $6,740 | $19,810 |
| 2021 | $3,023 | $26,550 | $6,740 | $19,810 |
| 2020 | $2,958 | $26,510 | $6,940 | $19,570 |
| 2019 | $2,963 | $26,510 | $6,940 | $19,570 |
| 2018 | $2,675 | $23,250 | $5,760 | $17,490 |
| 2017 | $2,433 | $23,250 | $5,760 | $17,490 |
| 2016 | $2,023 | $18,820 | $3,900 | $14,920 |
| 2015 | $2,020 | $18,820 | $3,900 | $14,920 |
| 2014 | -- | $16,280 | $3,260 | $13,020 |
Source: Public Records
Map
Nearby Homes
- 11630 Columbine St
- 2656 E 117th Way
- 11506 Adams St
- 11776 Saint Paul St
- 11546 Monroe Way
- 11304 Claude Ct
- 3000 E 112th Ave Unit 58
- 11817 Cook St
- 11861 Claude Way
- 11082 Fillmore Way
- 2063 Graves Ct
- 11879 Madison Place
- 11875 Claude Way
- 11149 Gaylord St
- 3491 E 119th St
- 11936 E 119th Place
- 11272 High St
- 11957 Claude Ct
- 11845 Garfield St
- 3880 E 117th Ave
- 11639 Clayton St
- 11659 Clayton St
- 11646 Josephine Cir
- 11626 Josephine Cir
- 11669 Clayton St
- 2793 E 116th Ave
- 2753 E 116th Ave
- 2803 E 116th Place
- 11656 Josephine Cir
- 11673 Clayton St
- 2804 E 116th Place
- 11666 Josephine Cir
- 2843 E 116th Place
- 11633 Josephine Cir
- 11695 Milwaukee St
- 11643 Josephine Cir
- 11674 Clayton St
- 11679 Clayton St
- 11653 Josephine Cir
- 2844 E 116th Place