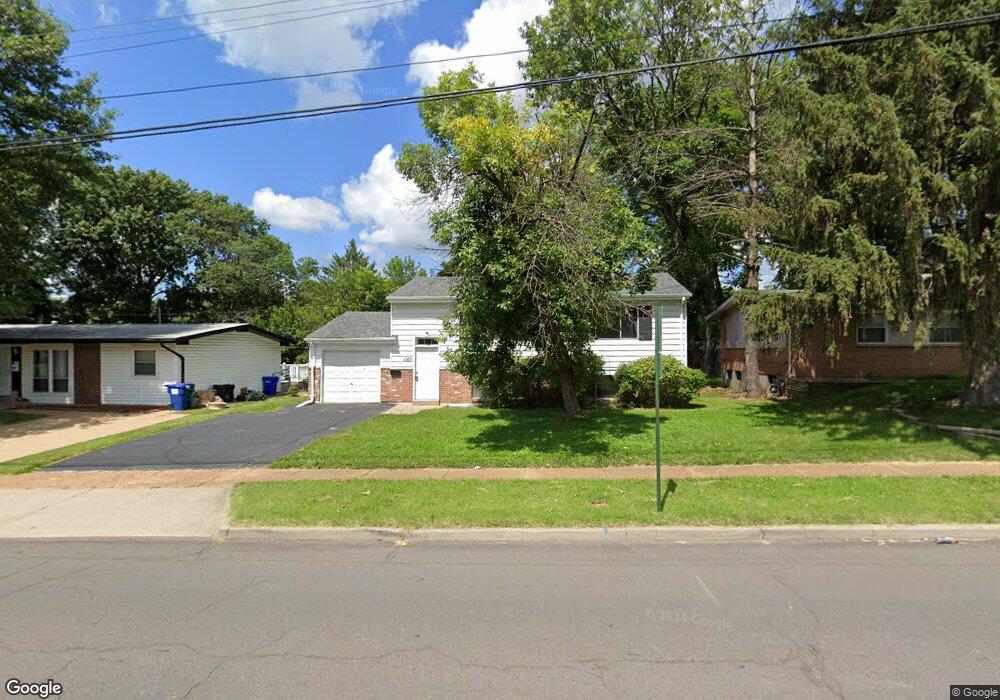
1165 Derhake Rd Florissant, MO 63033
Estimated Value: $168,000 - $201,000
4
Beds
3
Baths
1,728
Sq Ft
$110/Sq Ft
Est. Value
About This Home
This home is located at 1165 Derhake Rd, Florissant, MO 63033 and is currently estimated at $190,384, approximately $110 per square foot. 1165 Derhake Rd is a home located in St. Louis County with nearby schools including Robinwood Elementary School, Cross Keys Middle School, and McCluer North High School.
Ownership History
Date
Name
Owned For
Owner Type
Purchase Details
Closed on
Jan 27, 2025
Sold by
Jbs Properties Llc
Bought by
Coons Bradley and Coons Rachel
Current Estimated Value
Home Financials for this Owner
Home Financials are based on the most recent Mortgage that was taken out on this home.
Original Mortgage
$142,500
Outstanding Balance
$140,191
Interest Rate
6.72%
Mortgage Type
New Conventional
Estimated Equity
$50,193
Purchase Details
Closed on
Jan 24, 2025
Sold by
Winters Jara
Bought by
Winters Robert
Home Financials for this Owner
Home Financials are based on the most recent Mortgage that was taken out on this home.
Original Mortgage
$142,500
Outstanding Balance
$140,191
Interest Rate
6.72%
Mortgage Type
New Conventional
Estimated Equity
$50,193
Purchase Details
Closed on
Jan 18, 2012
Sold by
Secretary Of Housing & Urban Development
Bought by
Winters Robert
Purchase Details
Closed on
Jul 18, 2011
Sold by
Delmar Financial
Bought by
Secretary Of Housing & Urban Development
Purchase Details
Closed on
Jun 17, 2011
Sold by
Johnson Clifton and Johnson Ione
Bought by
Delmar Financial
Create a Home Valuation Report for This Property
The Home Valuation Report is an in-depth analysis detailing your home's value as well as a comparison with similar homes in the area
Home Values in the Area
Average Home Value in this Area
Purchase History
| Date | Buyer | Sale Price | Title Company |
|---|---|---|---|
| Coons Bradley | -- | Title Partners | |
| Jbs Properties Llc | -- | Title Partners | |
| Winters Robert | -- | Title Partners | |
| Winters Robert | $54,524 | None Available | |
| Secretary Of Housing & Urban Development | $60,926 | None Available | |
| Delmar Financial | $60,926 | None Available |
Source: Public Records
Mortgage History
| Date | Status | Borrower | Loan Amount |
|---|---|---|---|
| Open | Coons Bradley | $142,500 | |
| Closed | Winters Robert | $0 |
Source: Public Records
Tax History Compared to Growth
Tax History
| Year | Tax Paid | Tax Assessment Tax Assessment Total Assessment is a certain percentage of the fair market value that is determined by local assessors to be the total taxable value of land and additions on the property. | Land | Improvement |
|---|---|---|---|---|
| 2025 | $2,095 | $33,410 | $6,180 | $27,230 |
| 2024 | $2,095 | $27,000 | $4,640 | $22,360 |
| 2023 | $2,087 | $27,000 | $4,640 | $22,360 |
| 2022 | $2,010 | $22,860 | $4,640 | $18,220 |
| 2021 | $1,976 | $22,860 | $4,640 | $18,220 |
| 2020 | $1,858 | $20,210 | $3,570 | $16,640 |
| 2019 | $1,821 | $20,210 | $3,570 | $16,640 |
| 2018 | $1,794 | $17,780 | $2,050 | $15,730 |
| 2017 | $1,784 | $17,780 | $2,050 | $15,730 |
| 2016 | $1,539 | $14,910 | $2,050 | $12,860 |
| 2015 | $1,548 | $14,910 | $2,050 | $12,860 |
| 2014 | $1,468 | $14,590 | $3,460 | $11,130 |
Source: Public Records
Map
Nearby Homes
- 190 Coteau Ln
- 265 Waterford Dr
- 2 Carson Ct
- 375 Waterford Dr
- 130 Dauphin Ln
- 415 Waterford Dr
- 805 Derhake Rd
- 785 Bobbins Ln
- 12 Country Ln
- 750 Robinwood Dr
- 105 Capri Dr
- 2320 Allen Dr
- 100 Broadmere Dr
- 2505 Saint Catherine St
- 2240 Brook Dr
- 2340 Saint Catherine St
- 1606 Willow Wren Ct Unit 109
- 1609 Willow Wren Ct Unit 203
- 670 Hargrove Ln
- 505 Ridge Dr
- 1175 Derhake Rd
- 1145 Derhake Rd
- 1160 Apache Dr
- 1125 Derhake Rd
- 1140 Apache Dr
- 1170 Apache Dr
- 1195 Derhake Rd
- 270 Coteau Ln
- 1120 Apache Dr
- 45 Waterford Dr
- 1105 Derhake Rd
- 1196 Derhake Rd
- 1100 Apache Dr
- 260 Coteau Ln
- 275 Coteau Ln
- 1015 S Waterford Dr
- 1095 Derhake Rd
- 1090 Derhake Rd
- 250 Coteau Ln
- 1165 Apache Dr