1165 Division St NE Bandon, OR 97411
Estimated Value: $395,000 - $422,389
3
Beds
2
Baths
1,358
Sq Ft
$301/Sq Ft
Est. Value
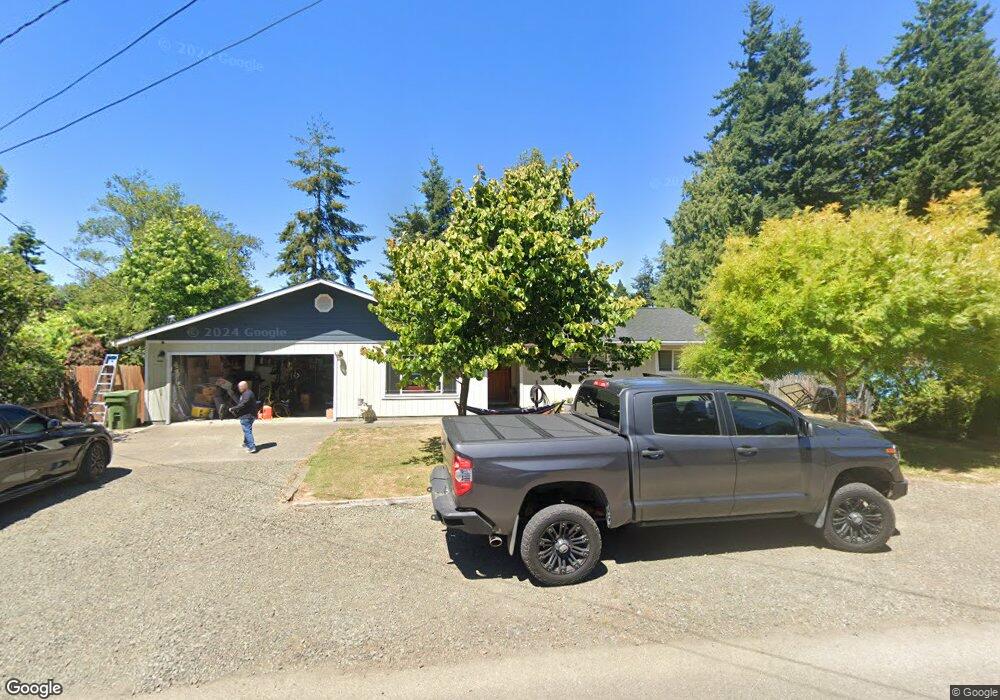
About This Home
This home is located at 1165 Division St NE, Bandon, OR 97411 and is currently estimated at $408,695, approximately $300 per square foot. 1165 Division St NE is a home located in Coos County with nearby schools including Ocean Crest Elementary School, Harbor Lights Middle School, and Bandon Senior High School.
Ownership History
Date
Name
Owned For
Owner Type
Purchase Details
Closed on
Apr 13, 2016
Sold by
Fannie Mae
Bought by
Cassoday Shellissa R
Current Estimated Value
Home Financials for this Owner
Home Financials are based on the most recent Mortgage that was taken out on this home.
Original Mortgage
$134,000
Outstanding Balance
$106,315
Interest Rate
3.64%
Mortgage Type
New Conventional
Estimated Equity
$302,380
Purchase Details
Closed on
Oct 26, 2015
Sold by
Angel Laura Lee
Bought by
Federal National Mortgage Association
Purchase Details
Closed on
Apr 3, 2007
Sold by
Locke Jason
Bought by
Schilling Robert Charles and Angel Laura Lee
Home Financials for this Owner
Home Financials are based on the most recent Mortgage that was taken out on this home.
Original Mortgage
$165,900
Interest Rate
6.2%
Mortgage Type
Purchase Money Mortgage
Create a Home Valuation Report for This Property
The Home Valuation Report is an in-depth analysis detailing your home's value as well as a comparison with similar homes in the area
Home Values in the Area
Average Home Value in this Area
Purchase History
| Date | Buyer | Sale Price | Title Company |
|---|---|---|---|
| Cassoday Shellissa R | $167,500 | Ticor Title Company Of Or | |
| Federal National Mortgage Association | -- | Accommodation | |
| Schilling Robert Charles | $237,000 | Ticor Title Insurance |
Source: Public Records
Mortgage History
| Date | Status | Borrower | Loan Amount |
|---|---|---|---|
| Open | Cassoday Shellissa R | $134,000 | |
| Previous Owner | Schilling Robert Charles | $165,900 |
Source: Public Records
Tax History Compared to Growth
Tax History
| Year | Tax Paid | Tax Assessment Tax Assessment Total Assessment is a certain percentage of the fair market value that is determined by local assessors to be the total taxable value of land and additions on the property. | Land | Improvement |
|---|---|---|---|---|
| 2024 | $1,874 | $166,920 | -- | -- |
| 2023 | $1,825 | $162,060 | $0 | $0 |
| 2022 | $1,832 | $157,340 | $0 | $0 |
| 2021 | $1,760 | $152,760 | $0 | $0 |
| 2020 | $1,598 | $152,760 | $0 | $0 |
| 2019 | $1,593 | $144,000 | $0 | $0 |
| 2018 | $1,498 | $139,810 | $0 | $0 |
| 2017 | $1,463 | $135,740 | $0 | $0 |
| 2016 | $1,418 | $131,790 | $0 | $0 |
| 2015 | $1,339 | $127,960 | $0 | $0 |
| 2014 | $1,339 | $124,240 | $0 | $0 |
Source: Public Records
Map
Nearby Homes
- 1113 1st St SE
- 1135 1st St NE
- 1105 1st St NE
- 89 Michigan Ave NE
- 0 1st St SE Unit 7801 24397077
- 0 1st St SE Unit 7800 24079518
- 0 1st St SE Unit 7800,01 24310339
- 950 1st St NE
- 501 North Ave
- 925 1st St NE
- 454 Michigan Ave NE
- 890 2nd St SE
- 0 28s-14w-19dd 2200 Unit 779404816
- 705 Ohio Ave NE
- 576 Klamath Ave NE Unit 1101
- 0 28s-14w-19dd 2000 Unit 186087382
- 830 3rd St SE
- 00 1st St SE
- 0 9th St NE Unit 7-10 24484508
- 870 11th St SE
- 0 Division St NE
- 1175 Division St NE
- 1155 Division St NE
- 1140 1st St NE
- 1150 1st St NE
- 1130 1st St NE
- 1160 1st St NE
- 1185 Division St NE
- 1125 Division St NE
- 1150 Division St SE
- 1160 Division St SE
- 1170 1st St NE
- 1130 Division St NE
- 1170 Division St SE
- 1120 1st St NE
- 44 Ohio Ave NE
- 86 North Ave SE
- 1180 Division St SE
- 86 North Ave NE
- 96 North Ave SE