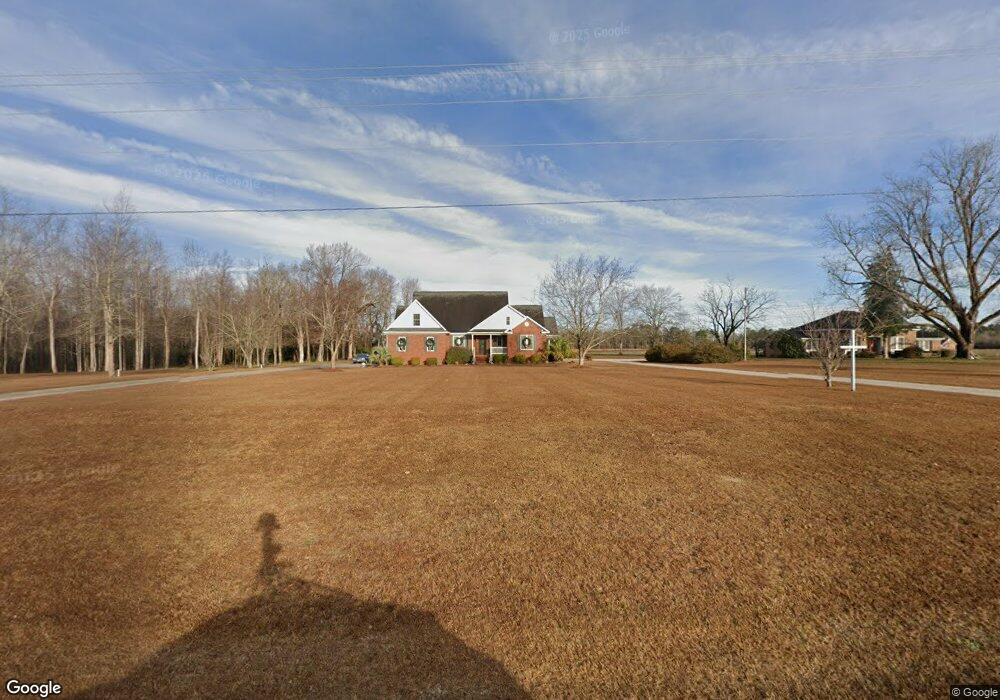
1165 E Myrtle Beach Hwy Scranton, SC 29591
Estimated Value: $237,061 - $258,000
4
Beds
2
Baths
2,649
Sq Ft
$93/Sq Ft
Est. Value
About This Home
This home is located at 1165 E Myrtle Beach Hwy, Scranton, SC 29591 and is currently estimated at $246,765, approximately $93 per square foot. 1165 E Myrtle Beach Hwy is a home located in Florence County with nearby schools including Ronald E. McNair Junior High School and Lake City High School.
Ownership History
Date
Name
Owned For
Owner Type
Purchase Details
Closed on
Apr 22, 2024
Sold by
Hendricks Gerri L
Bought by
Hendricks Charles D
Current Estimated Value
Home Financials for this Owner
Home Financials are based on the most recent Mortgage that was taken out on this home.
Original Mortgage
$40,000
Outstanding Balance
$34,562
Interest Rate
6.88%
Mortgage Type
Credit Line Revolving
Estimated Equity
$212,203
Purchase Details
Closed on
Aug 13, 2019
Sold by
Hendricks Tomothy N
Bought by
Hendricks Charles D
Home Financials for this Owner
Home Financials are based on the most recent Mortgage that was taken out on this home.
Original Mortgage
$162,120
Interest Rate
3.8%
Mortgage Type
FHA
Purchase Details
Closed on
Apr 27, 2018
Sold by
Labonte Julia G and Douglass Joan G
Bought by
Hendricks Charles D and Hendricks Timothy N
Create a Home Valuation Report for This Property
The Home Valuation Report is an in-depth analysis detailing your home's value as well as a comparison with similar homes in the area
Purchase History
| Date | Buyer | Sale Price | Title Company |
|---|---|---|---|
| Hendricks Charles D | -- | None Listed On Document | |
| Hendricks Charles D | -- | South Carolina Title | |
| Hendricks Charles D | -- | None Listed On Document | |
| Hendricks Charles D | -- | None Available | |
| Hendricks Charles D | $157,000 | None Available |
Source: Public Records
Mortgage History
| Date | Status | Borrower | Loan Amount |
|---|---|---|---|
| Open | Hendricks Charles D | $40,000 | |
| Closed | Hendricks Charles D | $40,000 | |
| Previous Owner | Hendricks Charles D | $162,120 |
Source: Public Records
Tax History
| Year | Tax Paid | Tax Assessment Tax Assessment Total Assessment is a certain percentage of the fair market value that is determined by local assessors to be the total taxable value of land and additions on the property. | Land | Improvement |
|---|---|---|---|---|
| 2025 | $768 | $8,463 | $284 | $8,179 |
| 2024 | $586 | $8,463 | $284 | $8,179 |
| 2023 | $536 | $5,908 | $285 | $5,623 |
| 2022 | $686 | $5,908 | $285 | $5,623 |
| 2021 | $568 | $5,910 | $0 | $0 |
| 2020 | $717 | $5,910 | $0 | $0 |
| 2019 | $723 | $5,908 | $285 | $5,623 |
| 2018 | $217 | $3,290 | $0 | $0 |
| 2017 | $223 | $3,290 | $0 | $0 |
| 2016 | $129 | $3,290 | $0 | $0 |
| 2015 | $129 | $3,290 | $0 | $0 |
| 2014 | $117 | $3,288 | $285 | $3,004 |
Source: Public Records
Map
Nearby Homes
- Tract 4 State Road S-21-881
- Red Barn Tract State Road S-21-881
- Tract 3 State Road S-21-881
- Tract 6 State Road S-21-881
- 1445 Victory Ln
- 1677 Cockfield Rd Unit LOT 8
- 1677 Cockfield Rd Unit LOT 10
- 1677 Cockfield Rd Unit LOT 11
- 1677 Cockfield Rd Unit LOT 9
- Sandridge Rd
- 2999 Fish Hawk Ln
- High Hill Rd
- 764 1st Oxtown Rd
- 249 E Main St
- 2224 N Church St
- TBD Indigo Landing Rd
- 306 Byrd St
- 1432 S Friendfield Rd
- 220 Brantley St
- 215 Brantley St
- 1165 E Myrtle Beach Hwy
- 1175 E Myrtle Beach Hwy
- 1175 E Myrtle Hwy
- 2143 Union School Rd
- 1083 Borkowitz Rd
- 2120 Union School Rd
- 2110 Union School Rd
- 1247 E Myrtle Beach Hwy
- 2203 Union School Rd
- 1820 Kelsey Rd
- 1048 Yarborough Rd
- 1115 Mcknight Rd
- 1316 Ronald Rd
- 1112 Mcknight Rd
- 1046 E Myrtle Beach Hwy
- 995 Borkowitz Rd
- 1731 Oakhurst Rd
- 2250 Union School Rd
- 2028 Keith Ln
- 1319 Ronald Rd
Your Personal Tour Guide
Ask me questions while you tour the home.