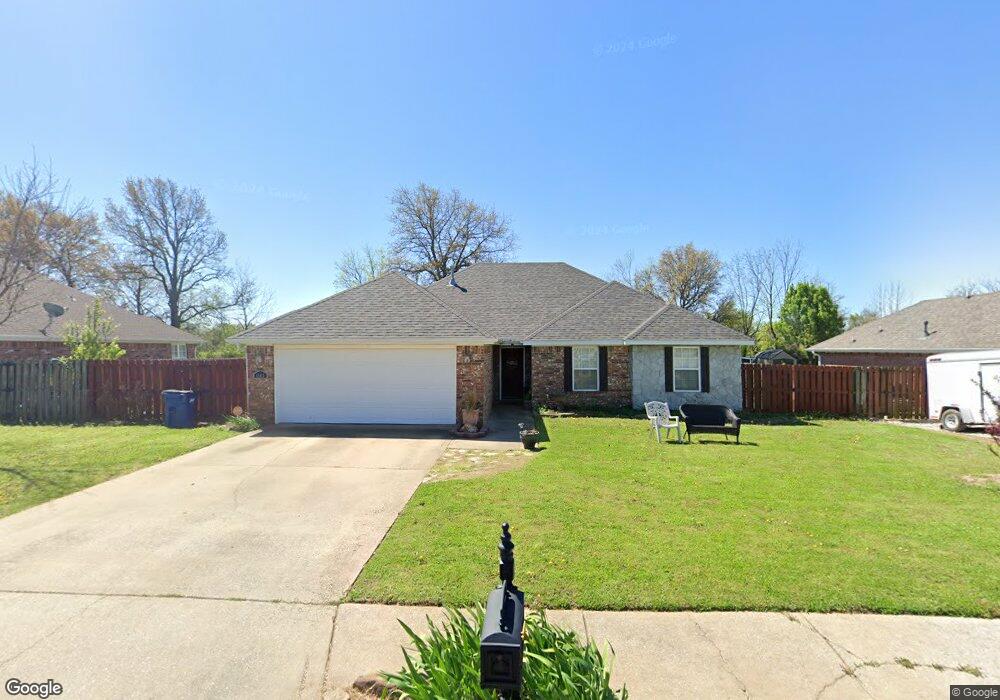
1165 Humphrey St Pea Ridge, AR 72751
Estimated Value: $293,000 - $304,000
--
Bed
2
Baths
1,586
Sq Ft
$189/Sq Ft
Est. Value
About This Home
This home is located at 1165 Humphrey St, Pea Ridge, AR 72751 and is currently estimated at $300,300, approximately $189 per square foot. 1165 Humphrey St is a home located in Benton County with nearby schools including Pea Ridge Primary School, Pea Ridge Intermediate School, and Pea Ridge Junior High School.
Ownership History
Date
Name
Owned For
Owner Type
Purchase Details
Closed on
May 13, 2015
Sold by
Young Tony Manuel and Young Samantha L
Bought by
Thurman Terry Lee
Current Estimated Value
Home Financials for this Owner
Home Financials are based on the most recent Mortgage that was taken out on this home.
Original Mortgage
$129,000
Outstanding Balance
$99,485
Interest Rate
3.71%
Mortgage Type
VA
Estimated Equity
$200,815
Purchase Details
Closed on
Mar 11, 2005
Sold by
Riggins Properties Inc
Bought by
Young Tony Manuel and Naifeh Samantha L
Home Financials for this Owner
Home Financials are based on the most recent Mortgage that was taken out on this home.
Original Mortgage
$132,350
Interest Rate
5.66%
Mortgage Type
FHA
Purchase Details
Closed on
Oct 12, 2004
Bought by
Riggins Prop 13P
Purchase Details
Closed on
Oct 1, 2004
Bought by
Riggins Prop 13P
Create a Home Valuation Report for This Property
The Home Valuation Report is an in-depth analysis detailing your home's value as well as a comparison with similar homes in the area
Home Values in the Area
Average Home Value in this Area
Purchase History
| Date | Buyer | Sale Price | Title Company |
|---|---|---|---|
| Thurman Terry Lee | $129,000 | First National Title Company | |
| Young Tony Manuel | $134,000 | None Available | |
| Riggins Prop 13P | $271,000 | -- | |
| Riggins Prop 13P | $271,000 | -- |
Source: Public Records
Mortgage History
| Date | Status | Borrower | Loan Amount |
|---|---|---|---|
| Open | Thurman Terry Lee | $129,000 | |
| Previous Owner | Young Tony Manuel | $132,350 |
Source: Public Records
Tax History Compared to Growth
Tax History
| Year | Tax Paid | Tax Assessment Tax Assessment Total Assessment is a certain percentage of the fair market value that is determined by local assessors to be the total taxable value of land and additions on the property. | Land | Improvement |
|---|---|---|---|---|
| 2025 | $2,220 | $55,410 | $6,400 | $49,010 |
| 2024 | $2,088 | $55,410 | $6,400 | $49,010 |
| 2023 | $1,819 | $37,170 | $5,600 | $31,570 |
| 2022 | $1,441 | $37,170 | $5,600 | $31,570 |
| 2021 | $1,342 | $37,170 | $5,600 | $31,570 |
| 2020 | $1,315 | $27,790 | $2,800 | $24,990 |
| 2019 | $1,315 | $27,790 | $2,800 | $24,990 |
| 2018 | $1,340 | $27,790 | $2,800 | $24,990 |
| 2017 | $1,231 | $27,790 | $2,800 | $24,990 |
| 2016 | $1,231 | $27,790 | $2,800 | $24,990 |
| 2015 | $1,232 | $21,650 | $4,000 | $17,650 |
| 2014 | $882 | $21,650 | $4,000 | $17,650 |
Source: Public Records
Map
Nearby Homes
- 1805 Abbott Ln
- 1805 Salmon St
- 1808 Abbott Ln
- 1285 Weston St
- 1804 Charles St
- 1808 Charles St
- 1901 Bergman Rd
- 1307 Joyce St
- 1305 Joyce St
- 2304 Salmon St
- 2300 Salmon St
- 2305 Salmon St
- 2301 Salmon St
- 2209 Salmon St
- 2213 Salmon St
- 2205 Salmon St
- 2201 Salmon St
- 2112 Salmon St
- 1703 Cuppett Cir
- 1701 Cuppett Cir
- 1185 Humphrey St
- 1145 Humphrey St
- 1205 Humphrey St
- 1105 Humphrey St
- 1363 Zachary St
- 1362 Zachary St
- 1225 Humphrey St
- 1075 Humphrey St
- 1393 Zachary St
- 1390 Zachary St
- 1226 Linder St
- 1363 St Claire St
- 1362 Hutchinson St
- 1245 Humphrey St
- 1413 Zachary St
- 1393 St Claire St
- 1412 Zachary St
- 1390 Hutchinson St
- 1248 Linder St
- 1316 St Clair St