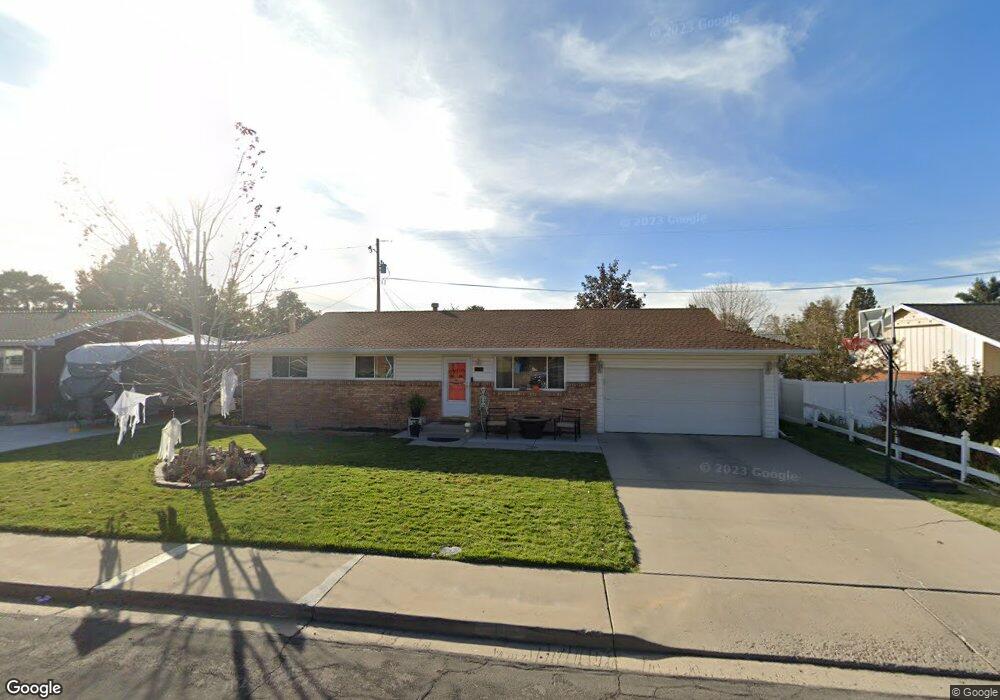
1165 N 50 E Orem, UT 84057
Windsor NeighborhoodEstimated Value: $529,128 - $550,000
3
Beds
2
Baths
1,492
Sq Ft
$361/Sq Ft
Est. Value
About This Home
This home is located at 1165 N 50 E, Orem, UT 84057 and is currently estimated at $539,043, approximately $361 per square foot. 1165 N 50 E is a home located in Utah County with nearby schools including Windsor School, Canyon View Junior High School, and Timpanogos High School.
Ownership History
Date
Name
Owned For
Owner Type
Purchase Details
Closed on
Jun 26, 2024
Sold by
Mason Bradley J and Mason Jennifer Anne
Bought by
Mason Bradley J and Mason Jensine Olson
Current Estimated Value
Purchase Details
Closed on
Jan 3, 2019
Sold by
Mason Bradley J
Bought by
Mason Bradley J and Mason Jennifer Anne
Purchase Details
Closed on
Feb 17, 2017
Sold by
Mason Jeanne Lynne and Mason Bradley J
Bought by
Mason Bradley J
Home Financials for this Owner
Home Financials are based on the most recent Mortgage that was taken out on this home.
Original Mortgage
$163,000
Interest Rate
4.12%
Mortgage Type
New Conventional
Purchase Details
Closed on
Mar 22, 2012
Sold by
Mason Bradley J
Bought by
Mason Bradley J and Mason Jeanne L
Home Financials for this Owner
Home Financials are based on the most recent Mortgage that was taken out on this home.
Original Mortgage
$44,300
Interest Rate
3.91%
Mortgage Type
Stand Alone Second
Purchase Details
Closed on
Mar 16, 2011
Sold by
Mason Bradley J
Bought by
Mason Bradley J and Mason Jeanne L
Home Financials for this Owner
Home Financials are based on the most recent Mortgage that was taken out on this home.
Original Mortgage
$37,000
Interest Rate
4.77%
Mortgage Type
New Conventional
Purchase Details
Closed on
Apr 12, 2010
Sold by
Mason Bradley J
Bought by
Mason Bradley J and Mason Jeanne L
Home Financials for this Owner
Home Financials are based on the most recent Mortgage that was taken out on this home.
Original Mortgage
$25,000
Interest Rate
4.95%
Mortgage Type
Stand Alone Second
Create a Home Valuation Report for This Property
The Home Valuation Report is an in-depth analysis detailing your home's value as well as a comparison with similar homes in the area
Home Values in the Area
Average Home Value in this Area
Purchase History
| Date | Buyer | Sale Price | Title Company |
|---|---|---|---|
| Mason Bradley J | -- | Access Title | |
| Mason Bradley J | -- | Provo Land Title Co | |
| Mason Bradley J | -- | Servicelink East Escrow | |
| Mason Bradley J | -- | None Available | |
| Masokn Bradley J | -- | None Available | |
| Mason Bradley J | -- | None Available | |
| Mason Bradley J | -- | Accommodation | |
| Mason Bradley J | -- | Landmark Title Company | |
| Mason Bradley J | -- | Accommodation | |
| Mason Bradley J | -- | Landmark Title Company |
Source: Public Records
Mortgage History
| Date | Status | Borrower | Loan Amount |
|---|---|---|---|
| Previous Owner | Mason Bradley J | $163,000 | |
| Previous Owner | Mason Bradley J | $44,300 | |
| Previous Owner | Mason Bradley J | $37,000 | |
| Previous Owner | Mason Bradley J | $25,000 |
Source: Public Records
Tax History
| Year | Tax Paid | Tax Assessment Tax Assessment Total Assessment is a certain percentage of the fair market value that is determined by local assessors to be the total taxable value of land and additions on the property. | Land | Improvement |
|---|---|---|---|---|
| 2025 | $2,199 | $272,250 | -- | -- |
| 2024 | $2,199 | $268,840 | $0 | $0 |
| 2023 | $2,033 | $267,190 | $0 | $0 |
| 2022 | $2,137 | $272,140 | $0 | $0 |
| 2021 | $1,813 | $349,700 | $146,100 | $203,600 |
| 2020 | $1,670 | $316,500 | $116,900 | $199,600 |
| 2019 | $1,550 | $305,500 | $105,900 | $199,600 |
| 2018 | $1,465 | $275,900 | $102,300 | $173,600 |
| 2017 | $1,430 | $144,265 | $0 | $0 |
| 2016 | $1,332 | $123,915 | $0 | $0 |
| 2015 | $1,367 | $120,285 | $0 | $0 |
| 2014 | $1,298 | $113,685 | $0 | $0 |
Source: Public Records
Map
Nearby Homes
- 16 E 925 N
- 917 N Garden Dr
- 1371 N 330 E Unit 8
- 125 W 870 N
- 372 E 1165 N
- 363 E 1395 N Unit 22
- 287 W 1380 N
- 789 200 E Unit 787
- 332 W Amiron Way Unit D
- 1480 N 430 E
- 362 E 800 N Unit 1
- 1548 N 275 West St Unit 2
- 1638 N 160 E
- 1461 N Amiron Way Unit B
- 1636 N 160 E
- 1566 N 275 West St Unit 1
- 1547 N 275 West St Unit 5
- 620 N 120 E
- 976 N 560 E
- 538 W 1120 N
Your Personal Tour Guide
Ask me questions while you tour the home.