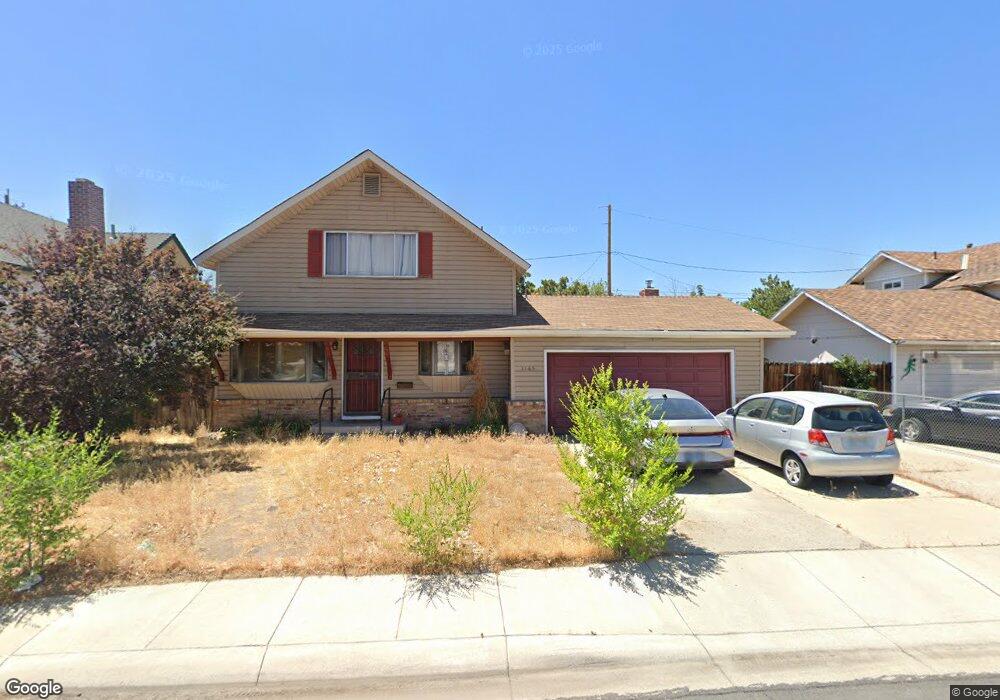
1165 Nyala St Reno, NV 89512
Northeast Reno NeighborhoodEstimated Value: $351,000 - $432,000
3
Beds
2
Baths
1,889
Sq Ft
$200/Sq Ft
Est. Value
About This Home
This home is located at 1165 Nyala St, Reno, NV 89512 and is currently estimated at $377,766, approximately $199 per square foot. 1165 Nyala St is a home located in Washoe County with nearby schools including Bernice Mathews Elementary School, Fred W. Traner Middle School, and Procter R. Hug High School.
Ownership History
Date
Name
Owned For
Owner Type
Purchase Details
Closed on
Jun 14, 2001
Sold by
Smith Phyllis Diane and Karlsen Phyllis D
Bought by
Smith Phyllis Diane and The Phyllis Smith Family Trust
Current Estimated Value
Create a Home Valuation Report for This Property
The Home Valuation Report is an in-depth analysis detailing your home's value as well as a comparison with similar homes in the area
Home Values in the Area
Average Home Value in this Area
Purchase History
| Date | Buyer | Sale Price | Title Company |
|---|---|---|---|
| Smith Phyllis Diane | -- | -- |
Source: Public Records
Tax History Compared to Growth
Tax History
| Year | Tax Paid | Tax Assessment Tax Assessment Total Assessment is a certain percentage of the fair market value that is determined by local assessors to be the total taxable value of land and additions on the property. | Land | Improvement |
|---|---|---|---|---|
| 2026 | -- | $52,086 | $27,720 | $24,366 |
| 2025 | $1,119 | $51,752 | $27,685 | $24,067 |
| 2024 | $1,119 | $51,147 | $27,510 | $23,637 |
| 2023 | $1,019 | $48,763 | $27,370 | $21,393 |
| 2022 | $944 | $40,427 | $22,960 | $17,467 |
| 2021 | $875 | $32,760 | $15,750 | $17,010 |
| 2020 | $848 | $30,830 | $14,140 | $16,690 |
| 2019 | $823 | $29,389 | $13,650 | $15,739 |
| 2018 | $800 | $25,552 | $10,430 | $15,122 |
| 2017 | $777 | $24,685 | $9,835 | $14,850 |
| 2016 | $764 | $23,676 | $8,820 | $14,856 |
| 2015 | $577 | $21,471 | $6,895 | $14,576 |
| 2014 | $743 | $19,931 | $5,460 | $14,471 |
| 2013 | -- | $19,496 | $4,690 | $14,806 |
Source: Public Records
Map
Nearby Homes
- 168 Poppy Ln
- 135 Carnation Ln
- 112 Lilac Ln
- 113 Lilac Ln
- 1885 Castle Way
- 1990 Trainer Way
- 2301 Oddie Blvd Unit 56
- 2301 Oddie Blvd Unit 162
- 2301 Oddie Blvd Unit 18
- 920 Montello St
- 1414 E 9th St Unit 4
- 2090 Fife Dr
- 1281 E 10th St
- 1436 E 9th St Unit 8
- 2335 Roundhouse Rd
- 2380 Roundhouse Rd
- 2282 Cannonball Rd
- 2371 Roundhouse Rd
- 2168 Cannonball Rd
- 2136 Roundhouse Rd
- 1175 Nyala St
- 1135 Nyala St
- 1125 Nyala St
- 2220 Mannington Ave
- 1160 Nyala St
- 2240 Mannington Ave
- 1101 Nyala St
- 1120 Nyala St
- 2250 Mannington Ave
- 1095 Nyala St
- 2225 Mannington Ave
- 2215 Mannington Ave
- 1134 Nyala St
- 1090 Nyala St
- 2235 Mannington Ave
- 1142 Nyala St
- 1138 Nyala St
- 2245 Mannington St
- 2245 Mannington Ave