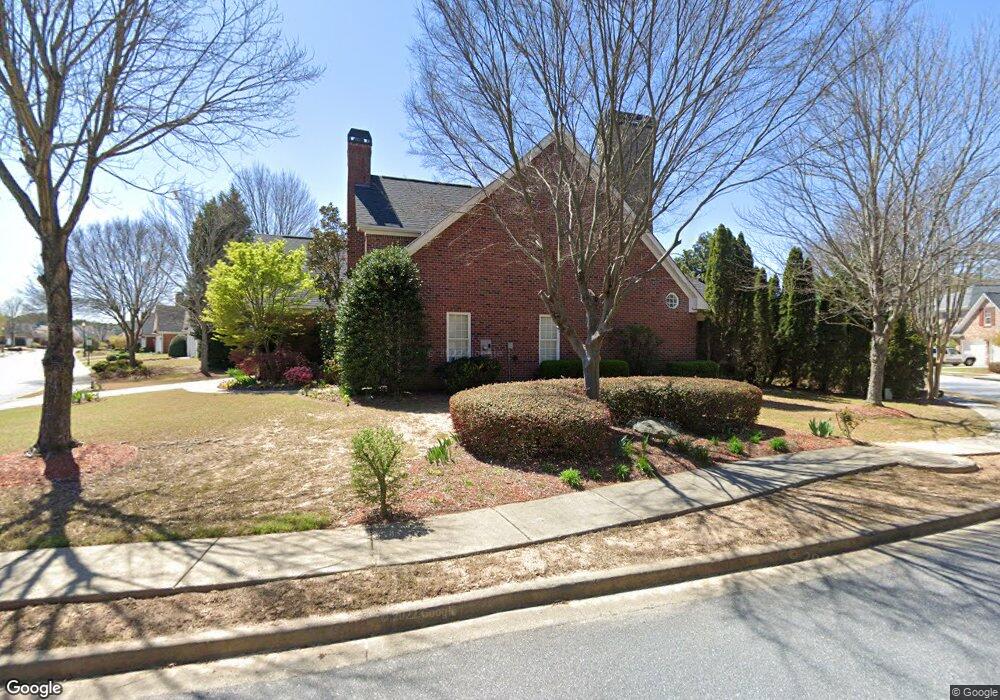
1165 Windsor Place Cir Unit 1 Grayson, GA 30017
Estimated Value: $485,991 - $518,000
4
Beds
3
Baths
3,013
Sq Ft
$167/Sq Ft
Est. Value
About This Home
This home is located at 1165 Windsor Place Cir Unit 1, Grayson, GA 30017 and is currently estimated at $502,498, approximately $166 per square foot. 1165 Windsor Place Cir Unit 1 is a home located in Gwinnett County with nearby schools including Grayson Elementary School, Bay Creek Middle School, and Grayson High School.
Ownership History
Date
Name
Owned For
Owner Type
Purchase Details
Closed on
Dec 8, 2022
Sold by
Carson Samuel
Bought by
Carson Sam and Sam Carson Rev Tr
Current Estimated Value
Purchase Details
Closed on
Aug 31, 2004
Sold by
Perdue Thomas K
Bought by
Carson Samuel and Carson Mary
Home Financials for this Owner
Home Financials are based on the most recent Mortgage that was taken out on this home.
Original Mortgage
$240,250
Interest Rate
4.5%
Mortgage Type
New Conventional
Purchase Details
Closed on
Jun 4, 2003
Sold by
Windsor Place Dev Llc
Bought by
Perdue Thomas K
Home Financials for this Owner
Home Financials are based on the most recent Mortgage that was taken out on this home.
Original Mortgage
$254,546
Interest Rate
5.17%
Mortgage Type
New Conventional
Create a Home Valuation Report for This Property
The Home Valuation Report is an in-depth analysis detailing your home's value as well as a comparison with similar homes in the area
Home Values in the Area
Average Home Value in this Area
Purchase History
| Date | Buyer | Sale Price | Title Company |
|---|---|---|---|
| Carson Sam | -- | -- | |
| Carson Samuel | $305,300 | -- | |
| Perdue Thomas K | -- | -- |
Source: Public Records
Mortgage History
| Date | Status | Borrower | Loan Amount |
|---|---|---|---|
| Previous Owner | Carson Samuel | $240,250 | |
| Previous Owner | Perdue Thomas K | $254,546 |
Source: Public Records
Tax History Compared to Growth
Tax History
| Year | Tax Paid | Tax Assessment Tax Assessment Total Assessment is a certain percentage of the fair market value that is determined by local assessors to be the total taxable value of land and additions on the property. | Land | Improvement |
|---|---|---|---|---|
| 2025 | $1,883 | $203,800 | $30,000 | $173,800 |
| 2024 | $1,866 | $194,840 | $30,000 | $164,840 |
| 2023 | $1,866 | $178,720 | $36,000 | $142,720 |
| 2022 | $1,809 | $166,520 | $32,000 | $134,520 |
| 2021 | $1,483 | $125,520 | $24,880 | $100,640 |
| 2020 | $1,717 | $119,800 | $24,880 | $94,920 |
| 2019 | $1,587 | $119,800 | $24,880 | $94,920 |
| 2018 | $1,587 | $119,800 | $24,880 | $94,920 |
| 2016 | $1,526 | $110,840 | $21,200 | $89,640 |
| 2015 | $1,567 | $110,840 | $21,200 | $89,640 |
| 2014 | $1,473 | $103,680 | $19,200 | $84,480 |
Source: Public Records
Map
Nearby Homes
- 725 Windsor Place Cir SW
- 2160 Railyard Ave
- 2120 Railyard Ave Unit 13
- 760 Windsor Place Cir
- 861 Pineberry Ct
- 740 Pineberry Ct
- 710 Pineberry Ct
- 2609 Jacobs Crest Cove
- 2028 Lakewood Cir
- 1891 Bennett Rd
- 936 Lakeview Oaks Ct
- 936 Lakeview Oaks Ct Unit 30-B
- 946 Ct
- 946 Lakeview Oaks Ct
- 956 Lakeview Oaks Ct
- 2031 Lakewood Cir
- 2199 Britt St
- 627 Heritage Post Ln
- 2160 Rail Yard Ave
- 1145 Windsor Place Cir
- 715 Windsor Place Cir Unit 1
- 1135 Windsor Place Cir
- 700 Windsor Place Cir
- 0 Windsor Place Cir Unit 8573011
- 0 Windsor Place Cir Unit 8599412
- 0 Windsor Place Cir Unit 8328369
- 0 Windsor Place Cir Unit 8994428
- 0 Windsor Place Cir Unit 9044277
- 0 Windsor Place Cir Unit 8736419
- 0 Windsor Place Cir Unit 8738556
- 0 Windsor Place Cir Unit 8750410
- 0 Windsor Place Cir Unit 8890135
- 0 Windsor Place Cir Unit 8902756
- 0 Windsor Place Cir Unit 3119589
- 0 Windsor Place Cir Unit 3194268
- 0 Windsor Place Cir Unit 3198812
- 0 Windsor Place Cir Unit 3229880
- 0 Windsor Place Cir Unit 7244473
- 0 Windsor Place Cir Unit 7283211