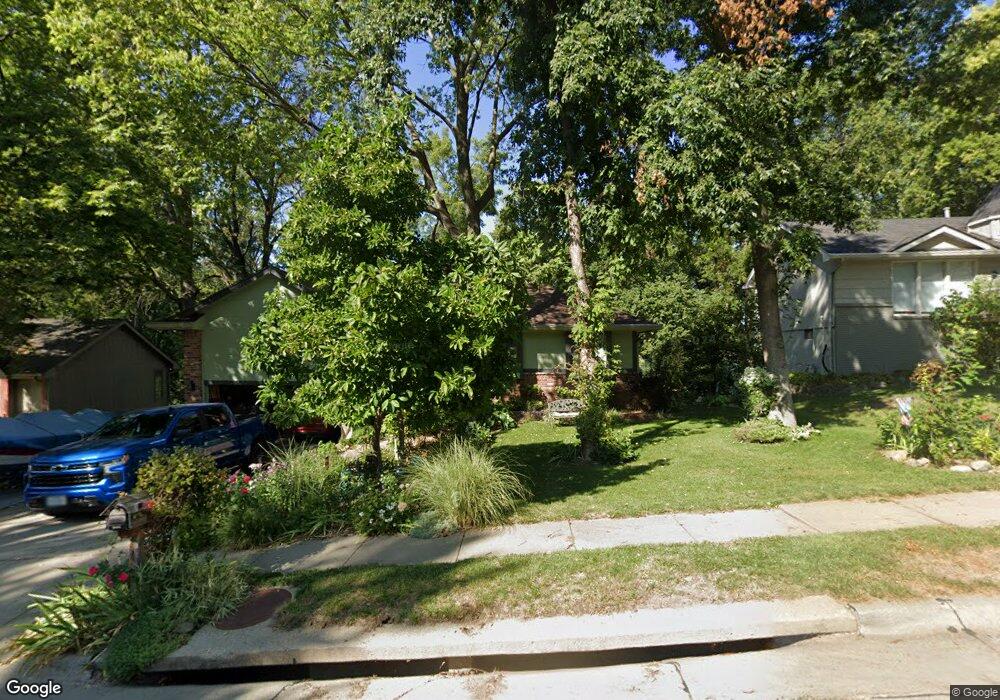
11651 Trumble Loup E Bellevue, NE 68123
Estimated Value: $362,000 - $406,000
3
Beds
3
Baths
2,738
Sq Ft
$139/Sq Ft
Est. Value
About This Home
This home is located at 11651 Trumble Loup E, Bellevue, NE 68123 and is currently estimated at $379,719, approximately $138 per square foot. 11651 Trumble Loup E is a home located in Sarpy County with nearby schools including Anderson Grove Elementary School, Papillion Middle School, and Papillion La Vista South High School.
Ownership History
Date
Name
Owned For
Owner Type
Purchase Details
Closed on
Dec 4, 2008
Sold by
Harbowy Daniel P and Harbowy Susan E
Bought by
Schuster Patrick J and Schuster Carol M
Current Estimated Value
Home Financials for this Owner
Home Financials are based on the most recent Mortgage that was taken out on this home.
Original Mortgage
$144,000
Interest Rate
5.17%
Mortgage Type
Unknown
Purchase Details
Closed on
Dec 13, 2005
Sold by
Konruff Terry L and Konruff Carole A
Bought by
Harbowy Daniel P and Harbowy Susan E
Home Financials for this Owner
Home Financials are based on the most recent Mortgage that was taken out on this home.
Original Mortgage
$109,950
Interest Rate
7.5%
Mortgage Type
Credit Line Revolving
Create a Home Valuation Report for This Property
The Home Valuation Report is an in-depth analysis detailing your home's value as well as a comparison with similar homes in the area
Home Values in the Area
Average Home Value in this Area
Purchase History
| Date | Buyer | Sale Price | Title Company |
|---|---|---|---|
| Schuster Patrick J | $211,000 | Nlta | |
| Harbowy Daniel P | $221,000 | -- |
Source: Public Records
Mortgage History
| Date | Status | Borrower | Loan Amount |
|---|---|---|---|
| Open | Schuster Patrick J | $208,080 | |
| Previous Owner | Harbowy Daniel P | $100,000 |
Source: Public Records
Tax History Compared to Growth
Tax History
| Year | Tax Paid | Tax Assessment Tax Assessment Total Assessment is a certain percentage of the fair market value that is determined by local assessors to be the total taxable value of land and additions on the property. | Land | Improvement |
|---|---|---|---|---|
| 2025 | $6,045 | $364,847 | $50,000 | $314,847 |
| 2024 | $6,462 | $347,193 | $45,000 | $302,193 |
| 2023 | $6,462 | $308,968 | $40,000 | $268,968 |
| 2022 | $5,989 | $270,162 | $40,000 | $230,162 |
| 2021 | $5,871 | $261,073 | $34,000 | $227,073 |
| 2020 | $5,588 | $247,093 | $34,000 | $213,093 |
| 2019 | $5,492 | $243,062 | $34,000 | $209,062 |
| 2018 | $5,258 | $229,416 | $28,000 | $201,416 |
| 2017 | $5,016 | $218,916 | $28,000 | $190,916 |
| 2016 | $4,909 | $214,565 | $28,000 | $186,565 |
| 2015 | $4,816 | $211,037 | $26,000 | $185,037 |
| 2014 | $4,580 | $199,432 | $26,000 | $173,432 |
| 2012 | -- | $196,844 | $26,000 | $170,844 |
Source: Public Records
Map
Nearby Homes
- 4305 Barksdale Dr
- 4614 Windcrest Dr
- 11809 Quail Dr
- 11817 Quail Dr
- 4320 Longview St
- 4714 Coffey St
- 11727 Quail Dr
- 4724 Coffey St
- 11406 S 43rd St
- 4406 Barksdale Dr
- 4917 Shannon Dr
- 4210 Barksdale Cir
- 4510 Barksdale Dr
- 5004 Westlake Cir
- 4552 Barksdale Dr
- 4556 Barksdale Dr
- 4918 Fountain Dr
- 4223 Barksdale Cir
- 5008 Westlake Cir
- 11412 S 47th St
- 11652 Trumble Loup W
- 11659 Trumble Loup E
- 11656 Trumble Loup W
- 11654 Trumble Loup E
- 11657 Trumble Loop W
- 11657 Trumble Loup W
- 11663 Trumble Loup E
- 11660 Trumble Loup W
- 11661 Trumble Loup W
- 11664 Trumble Loup E
- 11702 Gates Cir
- 11667 Trumble Loup E
- 11669 Trumble Loup W
- 11664 Trumble Loup W
- 11702 Gates Cir
- 11701 Gates Cir
- 11702 Trumble Loup E
- 11706 Gates Cir
- 11701 Gates Cir
- 11671 Trumble Loup E