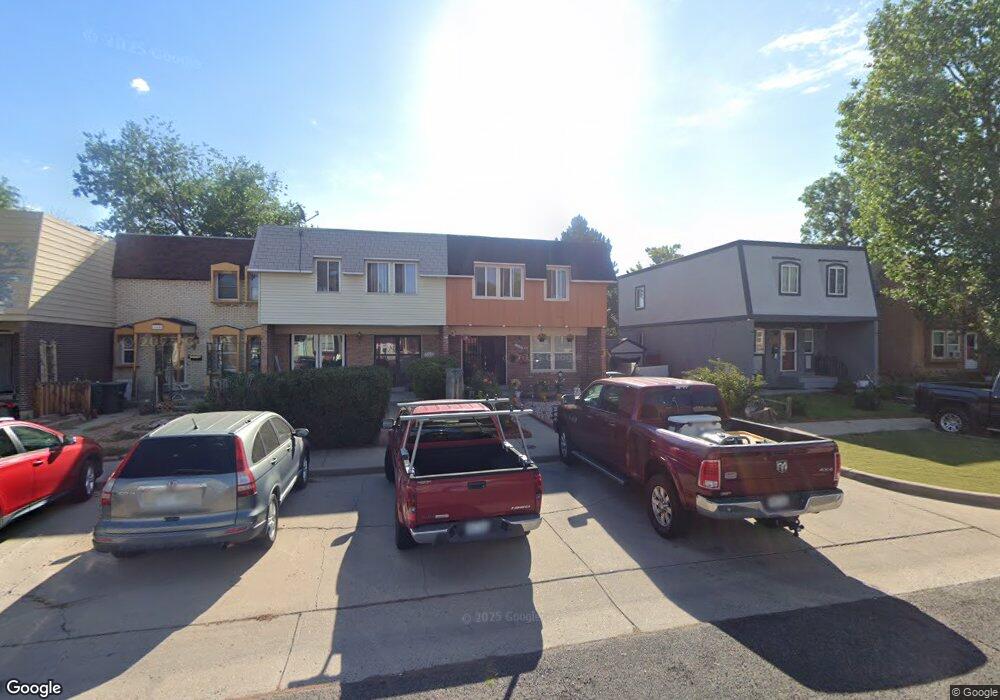
11652 Grant St Northglenn, CO 80233
Estimated Value: $351,000 - $373,000
3
Beds
3
Baths
1,995
Sq Ft
$182/Sq Ft
Est. Value
About This Home
This home is located at 11652 Grant St, Northglenn, CO 80233 and is currently estimated at $363,991, approximately $182 per square foot. 11652 Grant St is a home located in Adams County with nearby schools including Stukey Elementary School, Northglenn Middle School, and Thornton High School.
Ownership History
Date
Name
Owned For
Owner Type
Purchase Details
Closed on
Sep 13, 2019
Sold by
Mackendrick Heather A
Bought by
Gonzalez Maria C Gonzalez
Current Estimated Value
Home Financials for this Owner
Home Financials are based on the most recent Mortgage that was taken out on this home.
Original Mortgage
$219,760
Outstanding Balance
$191,211
Interest Rate
3.7%
Mortgage Type
New Conventional
Estimated Equity
$172,780
Purchase Details
Closed on
Oct 8, 2012
Sold by
Tochtrop Paul A and Tochtrop Heather A
Bought by
Mackendrick Heather A
Purchase Details
Closed on
Oct 19, 2001
Sold by
Bruner Cyndra J
Bought by
Tochtrop Paul A and Tochtrop Heather A
Home Financials for this Owner
Home Financials are based on the most recent Mortgage that was taken out on this home.
Original Mortgage
$147,155
Interest Rate
6.84%
Purchase Details
Closed on
Jul 12, 1996
Sold by
Melchizedek International
Bought by
Bruner Cyndra J
Purchase Details
Closed on
Jun 18, 1993
Sold by
Gilbreath Cyndra J
Bought by
Melchizedek International
Create a Home Valuation Report for This Property
The Home Valuation Report is an in-depth analysis detailing your home's value as well as a comparison with similar homes in the area
Home Values in the Area
Average Home Value in this Area
Purchase History
| Date | Buyer | Sale Price | Title Company |
|---|---|---|---|
| Gonzalez Maria C Gonzalez | $268,000 | Heritage Title Company | |
| Mackendrick Heather A | -- | None Available | |
| Tochtrop Paul A | $154,900 | -- | |
| Bruner Cyndra J | -- | -- | |
| Melchizedek International | -- | -- |
Source: Public Records
Mortgage History
| Date | Status | Borrower | Loan Amount |
|---|---|---|---|
| Open | Gonzalez Maria C Gonzalez | $219,760 | |
| Previous Owner | Tochtrop Paul A | $147,155 |
Source: Public Records
Tax History
| Year | Tax Paid | Tax Assessment Tax Assessment Total Assessment is a certain percentage of the fair market value that is determined by local assessors to be the total taxable value of land and additions on the property. | Land | Improvement |
|---|---|---|---|---|
| 2025 | $2,780 | $24,000 | $5,030 | $18,970 |
| 2024 | $2,780 | $22,070 | $4,630 | $17,440 |
| 2023 | $2,754 | $26,990 | $3,450 | $23,540 |
| 2022 | $2,411 | $19,090 | $3,540 | $15,550 |
| 2021 | $2,490 | $19,090 | $3,540 | $15,550 |
| 2020 | $2,352 | $18,410 | $3,650 | $14,760 |
| 2019 | $2,354 | $18,410 | $3,650 | $14,760 |
| 2018 | $1,918 | $14,620 | $1,080 | $13,540 |
| 2017 | $1,765 | $14,620 | $1,080 | $13,540 |
| 2016 | $1,384 | $11,190 | $1,190 | $10,000 |
| 2015 | $1,381 | $11,190 | $1,190 | $10,000 |
| 2014 | $1,017 | $8,030 | $1,190 | $6,840 |
Source: Public Records
Map
Nearby Homes
- 11651 Sherman St
- 11668 Lincoln St
- 11760 Grant St
- 11658 Community Center Dr Unit 99
- 11658 Community Center Dr Unit 97
- 11807 Sherman St
- 11524 Community Center Dr Unit 24
- 11608 Community Center Dr Unit 14
- 11518 Community Center Dr Unit 20
- 11632 Community Center Dr Unit 53
- 11470 Clarkson St
- 11735 Spring Dr
- 11217 Grant Dr Unit B1
- 11892 McCrumb Dr
- 284 W 116th Ave
- 11474 Marion St
- 598 Emery Rd
- 11966 Spring Dr
- 289 Muriel Dr
- 11258 Larson Ln
Your Personal Tour Guide
Ask me questions while you tour the home.