Estimated Value: $1,041,000 - $1,157,000
6
Beds
4
Baths
5,105
Sq Ft
$215/Sq Ft
Est. Value
About This Home
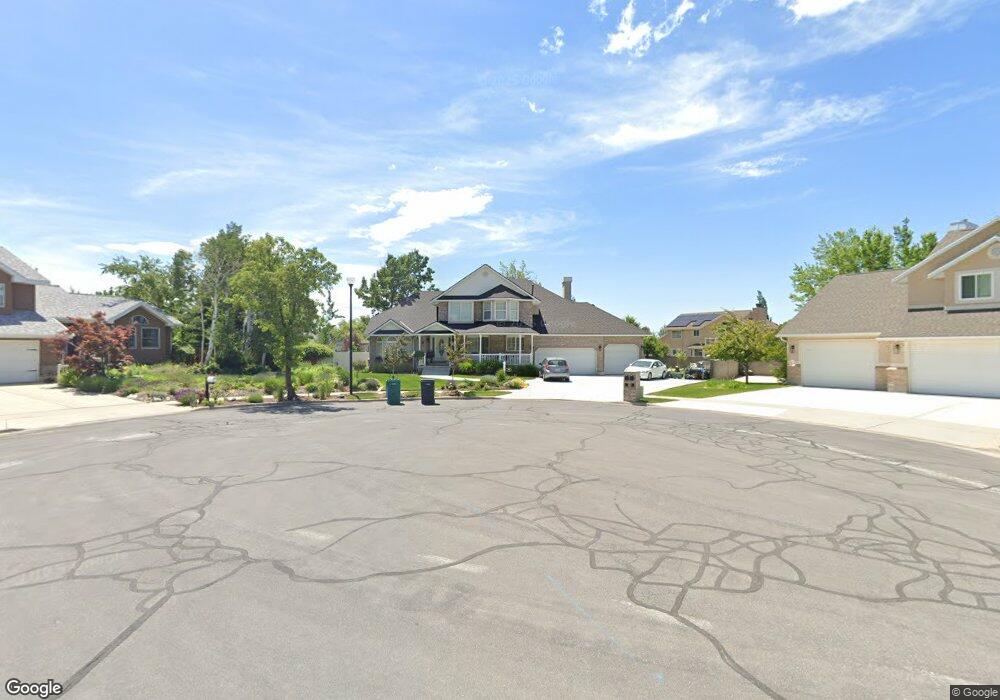
This home is located at 11658 S Carrington Ct, Sandy, UT 84092 and is currently estimated at $1,098,251, approximately $215 per square foot. 11658 S Carrington Ct is a home located in Salt Lake County with nearby schools including Bell Canyon Montessori School and Gateway Academy.
Ownership History
Date
Name
Owned For
Owner Type
Purchase Details
Closed on
Oct 25, 2016
Sold by
Pooler Angie E
Bought by
Morgan Alan D and Morgan Marci D
Current Estimated Value
Home Financials for this Owner
Home Financials are based on the most recent Mortgage that was taken out on this home.
Original Mortgage
$373,550
Outstanding Balance
$300,650
Interest Rate
3.5%
Mortgage Type
New Conventional
Estimated Equity
$797,601
Purchase Details
Closed on
Dec 19, 2002
Sold by
Skeele Frank P
Bought by
Pooler Angie E
Home Financials for this Owner
Home Financials are based on the most recent Mortgage that was taken out on this home.
Original Mortgage
$247,000
Interest Rate
6.03%
Purchase Details
Closed on
Dec 16, 2002
Sold by
Skeele Holly A
Bought by
Pooler Angie E
Home Financials for this Owner
Home Financials are based on the most recent Mortgage that was taken out on this home.
Original Mortgage
$247,000
Interest Rate
6.03%
Purchase Details
Closed on
May 27, 1999
Sold by
Skeele Frank P
Bought by
Skeele Frank P and Skeele Holly A
Home Financials for this Owner
Home Financials are based on the most recent Mortgage that was taken out on this home.
Original Mortgage
$175,000
Interest Rate
6.86%
Create a Home Valuation Report for This Property
The Home Valuation Report is an in-depth analysis detailing your home's value as well as a comparison with similar homes in the area
Home Values in the Area
Average Home Value in this Area
Purchase History
| Date | Buyer | Sale Price | Title Company |
|---|---|---|---|
| Morgan Alan D | -- | Landmark Title | |
| Pooler Angie E | -- | Metro National Title | |
| Pooler Angie E | -- | Metro National Title | |
| Skeele Frank P | -- | Superior Title Company | |
| Skeele Frank P | -- | Superior Title Company |
Source: Public Records
Mortgage History
| Date | Status | Borrower | Loan Amount |
|---|---|---|---|
| Open | Morgan Alan D | $373,550 | |
| Previous Owner | Pooler Angie E | $247,000 | |
| Previous Owner | Skeele Frank P | $175,000 |
Source: Public Records
Tax History Compared to Growth
Tax History
| Year | Tax Paid | Tax Assessment Tax Assessment Total Assessment is a certain percentage of the fair market value that is determined by local assessors to be the total taxable value of land and additions on the property. | Land | Improvement |
|---|---|---|---|---|
| 2025 | $5,250 | $1,032,700 | $255,000 | $777,700 |
| 2024 | $5,250 | $992,600 | $245,500 | $747,100 |
| 2023 | $4,847 | $915,700 | $236,000 | $679,700 |
| 2022 | $4,887 | $902,700 | $231,400 | $671,300 |
| 2021 | $4,456 | $700,800 | $201,200 | $499,600 |
| 2020 | $4,239 | $629,600 | $184,700 | $444,900 |
| 2019 | $4,336 | $628,600 | $174,200 | $454,400 |
| 2018 | $4,078 | $618,300 | $174,200 | $444,100 |
| 2017 | $3,357 | $487,100 | $174,200 | $312,900 |
| 2016 | $3,134 | $440,000 | $174,200 | $265,800 |
| 2015 | $3,357 | $436,900 | $184,700 | $252,200 |
| 2014 | $3,232 | $413,200 | $179,500 | $233,700 |
Source: Public Records
Map
Nearby Homes
- 2058 E Oak Manor Dr
- 11458 Lexington Hills Dr
- 1937 Wasatch Blvd
- 2234 E Willow Brook Way
- 15 Lone Hollow Dr
- 2022 Tall Pines Way
- 2412 Bear Hill Dr S
- 98 E Lone Hollow Dr S Unit 902
- 11939 S Hidden Canyon Ln
- 2026 E Tivoli Hills Ct
- 11551 S Woodhampton Dr Unit 2
- 11778 S 1700 E
- 2019 E Graystone Ct
- 1 Cross Hill Ln
- 1612 E Hidden Valley Rd
- 1644 Pebble Beach Cir
- 89 Lone Hollow Dr Unit 1026
- 12182 S Pine Valley Way
- 5 Quietwood Ln
- 11545 S Hagan Rd
- 11658 Carrington Ct
- 11666 Carrington Ct
- 11651 Terendale Ln
- 11648 Carrington Ct
- 11639 Terendale Ln
- 2168 E Wasatch Blvd
- 2168 Wasatch Blvd
- 2168 Wasatch Blvd Unit 12
- 11632 Carrington Ct
- 11632 S Carrington Ct
- 2160 E Wasatch Blvd
- 11667 Carrington Ct
- 2160 Wasatch Blvd
- 2160 Wasatch Blvd Unit 11
- 11657 Carrington Ct
- 2149 E Oak Leaf Way
- 2154 Wasatch Blvd
- 2154 Wasatch Blvd Unit 1
- 2154 Wasatch Blvd Unit 2
- 2149 Oak Leaf Way