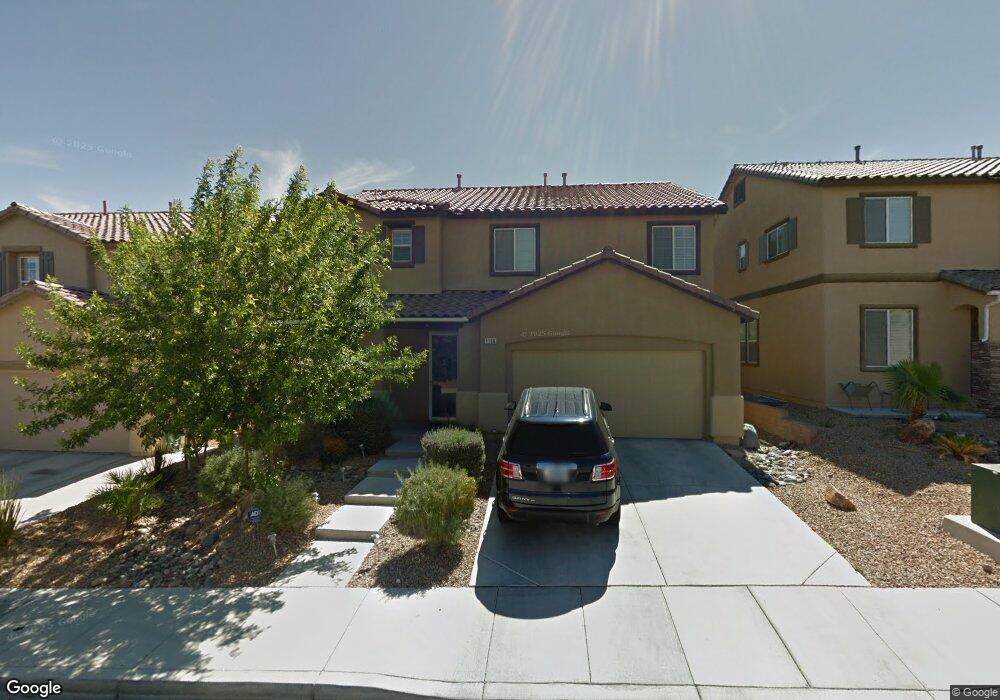
1166 Calvert St Henderson, NV 89002
Paradise Hills NeighborhoodEstimated Value: $561,738 - $634,000
4
Beds
3
Baths
2,805
Sq Ft
$212/Sq Ft
Est. Value
About This Home
This home is located at 1166 Calvert St, Henderson, NV 89002 and is currently estimated at $595,935, approximately $212 per square foot. 1166 Calvert St is a home located in Clark County with nearby schools including James E & A Rae Smalley Elementary School, Jack & Terry Mannion Middle School, and Foothill High School.
Ownership History
Date
Name
Owned For
Owner Type
Purchase Details
Closed on
Jan 31, 2024
Sold by
Faustino Khristian Magic and Faustino Katherina R
Bought by
Katherina And Khristians Trust
Current Estimated Value
Purchase Details
Closed on
Dec 17, 2014
Sold by
Faustino Katherina and Faustino Khristian Magic
Bought by
Faustino Khristian Magic and Faustino Katherina R
Home Financials for this Owner
Home Financials are based on the most recent Mortgage that was taken out on this home.
Original Mortgage
$340,400
Interest Rate
3.75%
Mortgage Type
New Conventional
Purchase Details
Closed on
Sep 21, 2005
Sold by
Kb Home Nevada Inc
Bought by
Blanco Katherina R
Home Financials for this Owner
Home Financials are based on the most recent Mortgage that was taken out on this home.
Original Mortgage
$387,533
Interest Rate
5.72%
Mortgage Type
Fannie Mae Freddie Mac
Create a Home Valuation Report for This Property
The Home Valuation Report is an in-depth analysis detailing your home's value as well as a comparison with similar homes in the area
Home Values in the Area
Average Home Value in this Area
Purchase History
| Date | Buyer | Sale Price | Title Company |
|---|---|---|---|
| Katherina And Khristians Trust | -- | None Listed On Document | |
| Faustino Khristian Magic | -- | Vantage Land Title | |
| Blanco Katherina R | $430,593 | First Amer Title Co Of Nv |
Source: Public Records
Mortgage History
| Date | Status | Borrower | Loan Amount |
|---|---|---|---|
| Previous Owner | Faustino Khristian Magic | $340,400 | |
| Previous Owner | Blanco Katherina R | $387,533 |
Source: Public Records
Tax History Compared to Growth
Tax History
| Year | Tax Paid | Tax Assessment Tax Assessment Total Assessment is a certain percentage of the fair market value that is determined by local assessors to be the total taxable value of land and additions on the property. | Land | Improvement |
|---|---|---|---|---|
| 2025 | $2,678 | $164,410 | $35,350 | $129,060 |
| 2024 | $2,601 | $164,410 | $35,350 | $129,060 |
| 2023 | $2,601 | $166,726 | $45,150 | $121,576 |
| 2022 | $2,768 | $147,569 | $36,750 | $110,819 |
| 2021 | $2,563 | $130,239 | $32,550 | $97,689 |
| 2020 | $2,377 | $133,062 | $29,050 | $104,012 |
| 2019 | $2,228 | $117,698 | $28,700 | $88,998 |
| 2018 | $2,126 | $107,427 | $23,450 | $83,977 |
| 2017 | $2,812 | $96,993 | $22,050 | $74,943 |
| 2016 | $1,990 | $83,349 | $16,800 | $66,549 |
| 2015 | $1,986 | $72,606 | $14,000 | $58,606 |
| 2014 | $1,924 | $64,453 | $10,150 | $54,303 |
Source: Public Records
Map
Nearby Homes
- 1140 Brent Park Ct
- 96 Cricklewood Ave
- 1141 Brent Park Ct
- 1174 Grove Park St
- 1184 Grove Park St
- 75 Archer Glen Ave
- 1144 Highbury Grove St
- 1221 Grove Park St
- 1218 Highbury Grove St
- 1208 Brockley Cross St
- 688 Monument Point St
- 676 Monument Point St
- 653 Monument Point St
- 645 Monument Point St
- 680 Moonlight Stroll St
- 167 Desert Pond Ave
- 181 Azalea Springs Ave
- 113 Lovage St
- 1051 Upper Springs St
- 0 N San Gregorio Cir
- 1162 Calvert St
- 1170 Calvert St
- 1158 Calvert St
- 1174 Calvert St
- 1167 Grove Park St
- 1163 Grove Park St
- 1171 Grove Park St
- 1159 Grove Park St
- 1175 Grove Park St
- 1154 Calvert St
- 1140 Orphington Ct
- 1144 Orphington Ct
- 1148 Orphington Ct
- 1155 Grove Park St
- 1150 Calvert St
- 1184 Calvert St
- 1139 Calvert St Unit 1
- 1139 Calvert St
- 1139 Calvert St Unit 2295
- 1152 Orphington Ct