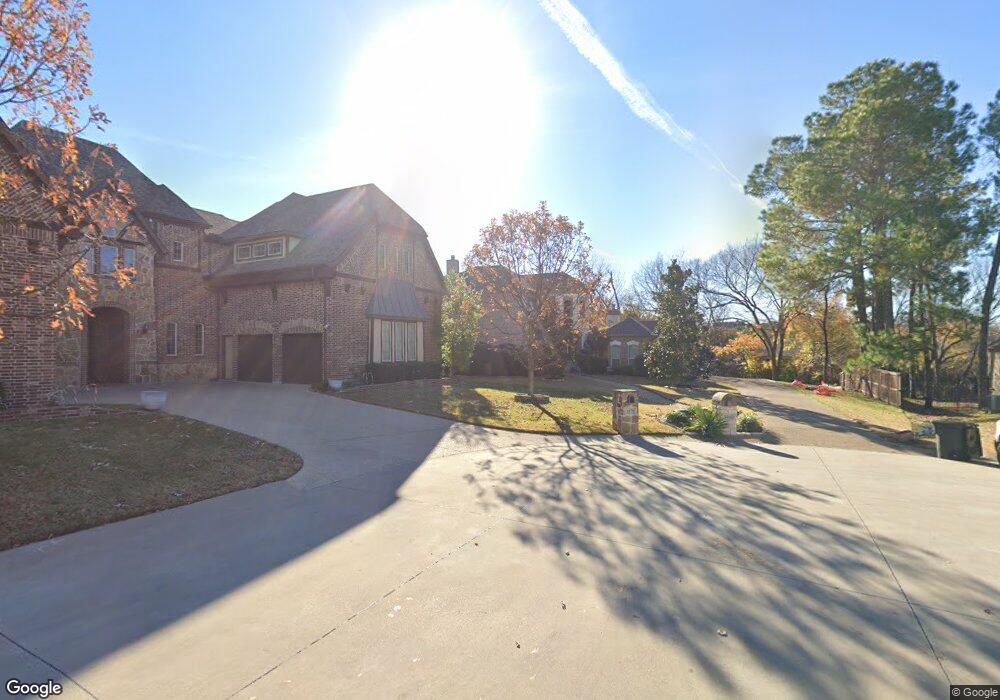
1166 Haven Cir Southlake, TX 76092
Estimated Value: $1,075,000 - $1,472,000
4
Beds
3
Baths
3,582
Sq Ft
$338/Sq Ft
Est. Value
About This Home
This home is located at 1166 Haven Cir, Southlake, TX 76092 and is currently estimated at $1,212,226, approximately $338 per square foot. 1166 Haven Cir is a home with nearby schools including Old Union Elementary School, Eubanks Intermediate School, and George Dawson Middle School.
Ownership History
Date
Name
Owned For
Owner Type
Purchase Details
Closed on
Jun 24, 2021
Sold by
Romano John L and Romano Christine V
Bought by
Romano John L
Current Estimated Value
Home Financials for this Owner
Home Financials are based on the most recent Mortgage that was taken out on this home.
Original Mortgage
$548,250
Outstanding Balance
$496,372
Interest Rate
2.9%
Mortgage Type
New Conventional
Estimated Equity
$715,854
Purchase Details
Closed on
Jan 26, 2012
Home Financials for this Owner
Home Financials are based on the most recent Mortgage that was taken out on this home.
Original Mortgage
$358,262
Interest Rate
4%
Mortgage Type
New Conventional
Purchase Details
Closed on
May 28, 2010
Sold by
Mooney Stephanie J and Mooney Terry D
Bought by
Bosworth Farms Ii Lp
Create a Home Valuation Report for This Property
The Home Valuation Report is an in-depth analysis detailing your home's value as well as a comparison with similar homes in the area
Home Values in the Area
Average Home Value in this Area
Purchase History
| Date | Buyer | Sale Price | Title Company |
|---|---|---|---|
| Romano John L | -- | National Assurance Title Inc | |
| -- | $358,262 | -- | |
| -- | $358,262 | -- | |
| Bosworth Farms Ii Lp | -- | Fidelity National Title |
Source: Public Records
Mortgage History
| Date | Status | Borrower | Loan Amount |
|---|---|---|---|
| Open | Romano John L | $548,250 | |
| Closed | Available Name Not | $358,262 |
Source: Public Records
Tax History Compared to Growth
Tax History
| Year | Tax Paid | Tax Assessment Tax Assessment Total Assessment is a certain percentage of the fair market value that is determined by local assessors to be the total taxable value of land and additions on the property. | Land | Improvement |
|---|---|---|---|---|
| 2025 | $13,554 | $900,000 | $262,500 | $637,500 |
| 2024 | $13,554 | $900,000 | $262,500 | $637,500 |
| 2023 | $16,404 | $900,000 | $262,500 | $637,500 |
| 2022 | $18,505 | $857,759 | $262,500 | $595,259 |
| 2021 | $18,459 | $860,367 | $262,500 | $597,867 |
| 2020 | $16,918 | $842,820 | $262,500 | $580,320 |
| 2019 | $16,202 | $845,338 | $262,500 | $582,838 |
| 2018 | $13,840 | $608,267 | $262,500 | $345,767 |
| 2017 | $13,706 | $933,908 | $262,500 | $671,408 |
| 2016 | $12,460 | $660,000 | $262,500 | $397,500 |
| 2015 | $10,793 | $457,000 | $150,000 | $307,000 |
| 2014 | $10,793 | $447,800 | $150,000 | $297,800 |
Source: Public Records
Map
Nearby Homes
- 710 Longford Dr
- 1420 Kensington Ct
- 1401 Chardonnay Ct
- 608 Regency Crossing
- 1100 La Paloma Ct
- 521 Regency Crossing
- 708 Nettleton Dr
- 1719 Byron Nelson Pkwy
- 1012 Cool River Dr
- 1227 Strathmore Dr
- 7208 Stilton Ct
- 712 Ashleigh Ln
- 7322 Calloway Ct
- 7316 Calloway Ct
- 1417 Nottoway Ct
- 1418 Nottoway Ct
- 1406 Nottoway Ct
- 702 Sussex Ct
- 1206 Timberline Ct
- 1304 Kings Brook Ct
- 1170 Haven Cir
- 1160 Haven Cir
- 1201 Earlston Ct
- 1205 Haven Cir
- 1200 Haven Cir
- 1200 Earlston Ct
- 1150 Haven Cir
- 1210 Haven Cir
- 1203 Earlston Ct
- 1215 Haven Cir
- 1203 Kirkcaldy Ct
- 1135 Haven Cir
- 1201 Kirkcaldy Ct
- 1220 Haven Cir
- 1225 Haven Cir
- 1501 Byron Nelson Pkwy
- 1021 E Continental Blvd
- 1125 Haven Cir
- 1503 Byron Nelson Pkwy
- 1230 Haven Cir