
Landlord's Agent in 2023
Brian Thompkins
NVision Realty & Consulting
(678) 371-2665
2 in this area
9 Total Sales
Estimated Value: $452,650 - $497,000
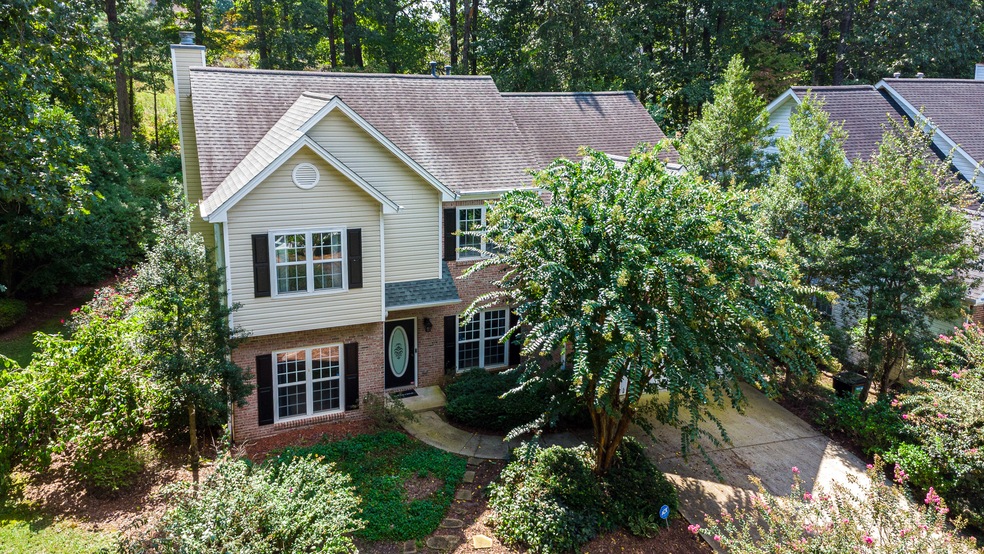
5 BED Rooms & 3 FULL Bathrooms, On 1.09 ACRES with an absolutely private backyard, surrounded by a botanical privacy fence. ***(((Flexible Leasing Terms))) ((3))-MONTH lease term rate = $3,990 per month, ((6))-MONTH lease term rate = $3,790 per month, 9-month lease term rate = $3,590 per month, ((12))-MONTH lease term rate = $2,990*** Do Not Disturb? Tour scheduling should allow for a 2 days notice ((48 hours)), at a minimum. -Copy of your driver's license. Most recent 2 pay stubs or offer letter. 600+ credit score, Income 3x's rent. -Centralized location! -There are outside security cameras, & a ring doorbell by the front door. -Very spacious, family-friendly home with comfy beds & smart tvs -Minutes from Gwinnett County Zoo and Stone Mountain Park -30 minutes from Downtown Atlanta, the Fox Theatre, & Atlanta airport -Close to main highways, retail, grocery stores, & restaurant -Utilities included, Formal living & dining areas with an open kitchen. -1 King, 3 Queens, 3 twins, Fireplace. -Free driveway parking on premises a 4-space -The home is outfitted with outside security cameras, & a Skybell doorbell at the front door.
Last Agent to Rent the Property
NVision Realty & Consulting Brokerage Phone: 6783712665 License #392860 Listed on: 10/03/2023
Last Renter's Agent
No Sales Agent
Non-Mls Company License #0
| Date | Buyer | Sale Price | Title Company |
|---|---|---|---|
| Stk Trust | -- | -- | |
| Davis Khalilah | -- | -- | |
| Davis Khalilah | $420,000 | -- | |
| Ramakrishnan Sunil Raj Vadakkunnat | $400,000 | -- | |
| Elixson E Marsha Trust | -- | -- | |
| Elixson E Marsha | $165,800 | -- |
| Date | Status | Borrower | Loan Amount |
|---|---|---|---|
| Previous Owner | Davis Khalilah | $412,392 | |
| Previous Owner | Elixson E Marsha | $100,000 |
| Date | Event | Price | List to Sale | Price per Sq Ft | Prior Sale |
|---|---|---|---|---|---|
| 11/02/2023 11/02/23 | Rented | $5,000 | +67.2% | -- | |
| 10/03/2023 10/03/23 | For Rent | $2,990 | 0.0% | -- | |
| 09/01/2022 09/01/22 | Sold | $449,900 | +5.9% | $170 / Sq Ft | View Prior Sale |
| 07/29/2022 07/29/22 | Pending | -- | -- | -- | |
| 07/24/2022 07/24/22 | For Sale | $424,900 | 0.0% | $160 / Sq Ft | |
| 07/22/2022 07/22/22 | Pending | -- | -- | -- | |
| 07/19/2022 07/19/22 | Price Changed | $424,900 | -3.4% | $160 / Sq Ft | |
| 06/28/2022 06/28/22 | Price Changed | $439,900 | -2.2% | $166 / Sq Ft | |
| 06/24/2022 06/24/22 | For Sale | $449,900 | 0.0% | $170 / Sq Ft | |
| 06/20/2022 06/20/22 | Pending | -- | -- | -- | |
| 06/16/2022 06/16/22 | For Sale | $449,900 | +12.5% | $170 / Sq Ft | |
| 09/30/2021 09/30/21 | Sold | $400,000 | +3.9% | $151 / Sq Ft | View Prior Sale |
| 08/23/2021 08/23/21 | Pending | -- | -- | -- | |
| 08/19/2021 08/19/21 | For Sale | $385,000 | -- | $145 / Sq Ft |
| Year | Tax Paid | Tax Assessment Tax Assessment Total Assessment is a certain percentage of the fair market value that is determined by local assessors to be the total taxable value of land and additions on the property. | Land | Improvement |
|---|---|---|---|---|
| 2025 | $5,835 | $172,640 | $30,920 | $141,720 |
| 2024 | $5,784 | $163,480 | $30,920 | $132,560 |
| 2023 | $5,784 | $163,640 | $36,920 | $126,720 |
| 2022 | $3,352 | $150,960 | $31,720 | $119,240 |
| 2021 | $3,352 | $110,200 | $24,280 | $85,920 |
| 2020 | $3,378 | $110,200 | $24,280 | $85,920 |
| 2019 | $3,172 | $110,200 | $24,280 | $85,920 |
| 2018 | $3,172 | $102,000 | $20,920 | $81,080 |
| 2016 | $2,868 | $86,920 | $18,200 | $68,720 |
| 2015 | $2,808 | $83,160 | $16,920 | $66,240 |
| 2014 | $2,769 | $81,160 | $16,920 | $64,240 |
Landlord's Agent in 2023
Brian Thompkins
NVision Realty & Consulting
(678) 371-2665
2 in this area
9 Total Sales
N
Tenant's Agent in 2023
No Sales Agent
Non-Mls Company
Seller's Agent in 2022
Matt Hermes
Keller Williams Realty Atl. Partners
(770) 402-2819
1 in this area
242 Total Sales
Seller Co-Listing Agent in 2022
Sandy Baker
Keller Williams Realty Atl. Partners
(316) 992-7156
3 in this area
166 Total Sales
Seller's Agent in 2021
Amanda Livermont
Faith Realty & Associates, Inc.
(678) 491-7457
3 in this area
79 Total Sales
Source: Georgia MLS
MLS Number: 10209501
APN: 6-091-300
Disclaimer: Certain information contained herein is derived from information provided by parties other than Homes.com. All information provided is deemed reliable, but is not guaranteed to be accurate and should be independently verified.
![]() The data relating to real estate for sale on this web site comes in part from the Broker Reciprocity Program of Georgia MLS. Real estate listings held by brokerage firms other than Redfin are marked with the Broker Reciprocity logo and detailed information about them includes the name of the listing brokers. Information deemed reliable but not guaranteed. Copyright 2025 Georgia MLS. All rights reserved.
The data relating to real estate for sale on this web site comes in part from the Broker Reciprocity Program of Georgia MLS. Real estate listings held by brokerage firms other than Redfin are marked with the Broker Reciprocity logo and detailed information about them includes the name of the listing brokers. Information deemed reliable but not guaranteed. Copyright 2025 Georgia MLS. All rights reserved.