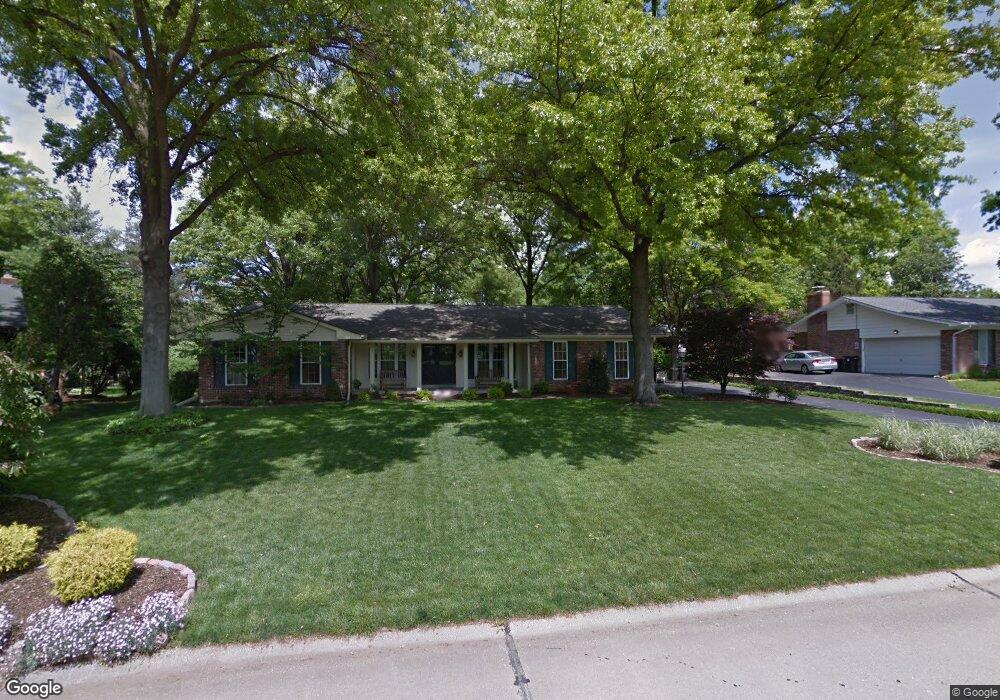
11661 Rossmoor Ln Saint Louis, MO 63128
Estimated Value: $385,000 - $442,000
3
Beds
3
Baths
1,878
Sq Ft
$215/Sq Ft
Est. Value
About This Home
This home is located at 11661 Rossmoor Ln, Saint Louis, MO 63128 and is currently estimated at $404,179, approximately $215 per square foot. 11661 Rossmoor Ln is a home located in St. Louis County with nearby schools including Sappington Elementary School, Sperreng Middle School, and Lindbergh High School.
Ownership History
Date
Name
Owned For
Owner Type
Purchase Details
Closed on
Apr 14, 2016
Sold by
Carey Cameron M and Carey Sharon K
Bought by
Carey Cameron M and Carey Sharon K
Current Estimated Value
Purchase Details
Closed on
Oct 27, 2000
Sold by
Khan Karen J
Bought by
Carey Cameron M and Carey Sharon K
Home Financials for this Owner
Home Financials are based on the most recent Mortgage that was taken out on this home.
Original Mortgage
$180,000
Outstanding Balance
$65,409
Interest Rate
7.87%
Estimated Equity
$338,770
Purchase Details
Closed on
Nov 7, 1997
Sold by
Khan Karen J
Bought by
Khan Karen J
Home Financials for this Owner
Home Financials are based on the most recent Mortgage that was taken out on this home.
Original Mortgage
$141,750
Interest Rate
7.28%
Create a Home Valuation Report for This Property
The Home Valuation Report is an in-depth analysis detailing your home's value as well as a comparison with similar homes in the area
Home Values in the Area
Average Home Value in this Area
Purchase History
| Date | Buyer | Sale Price | Title Company |
|---|---|---|---|
| Carey Cameron M | -- | None Available | |
| Carey Cameron M | $225,000 | -- | |
| Khan Karen J | -- | -- |
Source: Public Records
Mortgage History
| Date | Status | Borrower | Loan Amount |
|---|---|---|---|
| Open | Carey Cameron M | $180,000 | |
| Previous Owner | Khan Karen J | $141,750 | |
| Closed | Carey Cameron M | $22,500 |
Source: Public Records
Tax History Compared to Growth
Tax History
| Year | Tax Paid | Tax Assessment Tax Assessment Total Assessment is a certain percentage of the fair market value that is determined by local assessors to be the total taxable value of land and additions on the property. | Land | Improvement |
|---|---|---|---|---|
| 2025 | $4,000 | $74,230 | $22,400 | $51,830 |
| 2024 | $4,000 | $61,500 | $20,540 | $40,960 |
| 2023 | $3,991 | $61,500 | $20,540 | $40,960 |
| 2022 | $3,738 | $55,270 | $18,680 | $36,590 |
| 2021 | $3,606 | $55,270 | $18,680 | $36,590 |
| 2020 | $3,372 | $49,840 | $17,330 | $32,510 |
| 2019 | $3,363 | $49,840 | $17,330 | $32,510 |
| 2018 | $3,047 | $41,040 | $10,620 | $30,420 |
| 2017 | $3,014 | $41,040 | $10,620 | $30,420 |
| 2016 | $2,891 | $37,370 | $10,620 | $26,750 |
| 2015 | $2,847 | $37,370 | $10,620 | $26,750 |
| 2014 | $2,684 | $34,870 | $9,030 | $25,840 |
Source: Public Records
Map
Nearby Homes
- 11673 Rossmoor Ln
- 11542 Concord Village Ave
- 5837 Oak Forest Ln
- 11862 E Concord Rd
- 11345 Revere Ln
- 10903 Village Grove Dr Unit D
- 10924 Village Grove Dr Unit C
- 12015 Charwick Dr
- 9932 Jan Dr
- 10923 Suanis Ct
- 25 Fawnwood Dr
- 10080 Sakura Dr Unit 1
- 10080 Sakura Dr Unit 8
- 10070 Sakura Dr Unit 100070
- 10117 Sakura Dr Unit F
- 4838 Dorsie Dr
- 12055 Charwick Dr
- 10682 Carroll Wood Way Unit 3
- 10140 Sakura Dr
- 10622 Carroll Wood Way
- 11605 Rossmoor Ln
- 11667 Rossmoor Ln
- 11655 Rossmoor Ln
- 11609 Rossmoor Ln
- 11662 Rossmoor Ln
- 11600 Rossmoor Ln
- 11654 Rossmoor Ln
- 11606 Tescord Dr
- 11622 Tescord Dr
- 11681 Rossmoor Ln
- 11604 Rossmoor Ln
- 11680 Rossmoor Ln
- 9823 Chatsworth Dr
- 11634 Rossmoor Ln
- 11630 Tescord Dr
- 11648 Rossmoor Ln
- 11642 Rossmoor Ln
- 11626 Rossmoor Ln
- 9815 Chatsworth Dr
- 11600 Tescord Dr