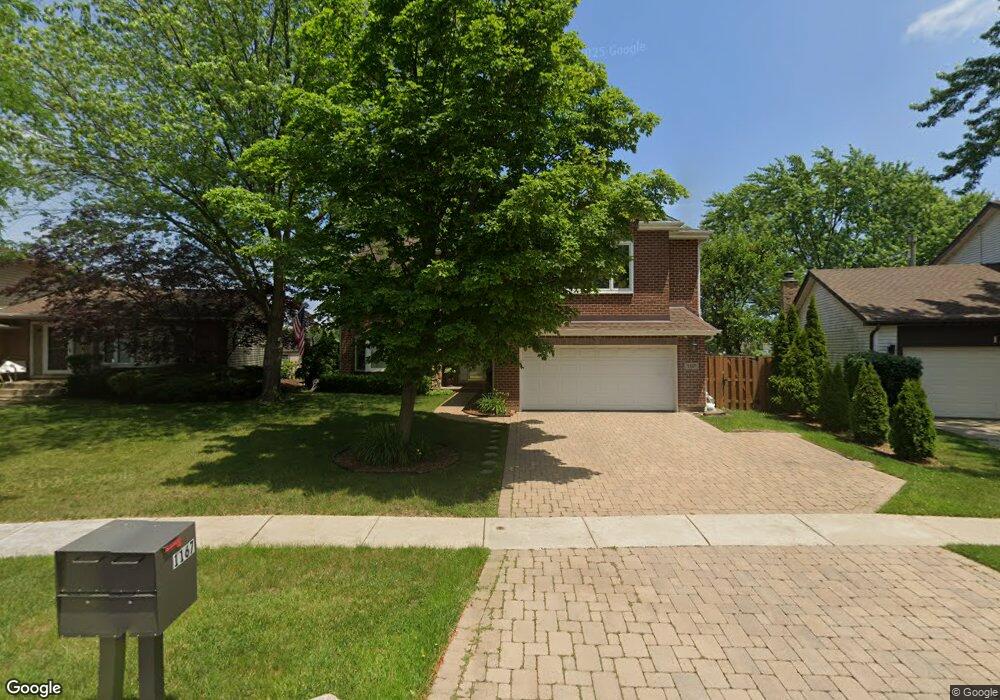
1167 Green Knolls Dr Buffalo Grove, IL 60089
Estimated Value: $655,000 - $796,000
4
Beds
4
Baths
3,146
Sq Ft
$232/Sq Ft
Est. Value
About This Home
This home is located at 1167 Green Knolls Dr, Buffalo Grove, IL 60089 and is currently estimated at $730,087, approximately $232 per square foot. 1167 Green Knolls Dr is a home located in Lake County with nearby schools including Prairie Elementary School, Twin Groves Middle School, and Adlai E Stevenson High School.
Ownership History
Date
Name
Owned For
Owner Type
Purchase Details
Closed on
Aug 11, 2004
Sold by
Weichert Relocation Resources Inc
Bought by
Rybin Steve and Rybin Tatyana
Current Estimated Value
Home Financials for this Owner
Home Financials are based on the most recent Mortgage that was taken out on this home.
Original Mortgage
$326,400
Outstanding Balance
$162,717
Interest Rate
6.08%
Mortgage Type
Purchase Money Mortgage
Estimated Equity
$567,370
Purchase Details
Closed on
Jul 10, 2004
Sold by
Ando David T and Ando Lori L
Bought by
Weichert Relocation Resources Inc
Home Financials for this Owner
Home Financials are based on the most recent Mortgage that was taken out on this home.
Original Mortgage
$326,400
Outstanding Balance
$162,717
Interest Rate
6.08%
Mortgage Type
Purchase Money Mortgage
Estimated Equity
$567,370
Create a Home Valuation Report for This Property
The Home Valuation Report is an in-depth analysis detailing your home's value as well as a comparison with similar homes in the area
Home Values in the Area
Average Home Value in this Area
Purchase History
| Date | Buyer | Sale Price | Title Company |
|---|---|---|---|
| Rybin Steve | $408,000 | Greater Illinois Title Compa | |
| Weichert Relocation Resources Inc | $408,000 | Greater Illinois Title Compa |
Source: Public Records
Mortgage History
| Date | Status | Borrower | Loan Amount |
|---|---|---|---|
| Open | Rybin Steve | $326,400 |
Source: Public Records
Tax History Compared to Growth
Tax History
| Year | Tax Paid | Tax Assessment Tax Assessment Total Assessment is a certain percentage of the fair market value that is determined by local assessors to be the total taxable value of land and additions on the property. | Land | Improvement |
|---|---|---|---|---|
| 2024 | $20,504 | $231,338 | $40,208 | $191,130 |
| 2023 | $18,828 | $207,889 | $36,132 | $171,757 |
| 2022 | $18,828 | $186,560 | $32,425 | $154,135 |
| 2021 | $18,117 | $184,548 | $32,075 | $152,473 |
| 2020 | $17,392 | $185,177 | $32,184 | $152,993 |
| 2019 | $17,140 | $184,494 | $32,065 | $152,429 |
| 2018 | $11,294 | $167,221 | $31,691 | $135,530 |
| 2017 | $13,259 | $163,317 | $30,951 | $132,366 |
| 2016 | $13,578 | $160,403 | $29,638 | $130,765 |
| 2015 | $13,226 | $150,007 | $27,717 | $122,290 |
| 2014 | $12,314 | $139,452 | $29,767 | $109,685 |
| 2012 | $12,223 | $125,905 | $29,827 | $96,078 |
Source: Public Records
Map
Nearby Homes
- 1315 Gail Dr
- 810 Silver Rock Ln
- 938 Hidden Lake Dr
- 760 Checker Dr
- 531 Lasalle Ln
- 620 Twisted Oak Ln
- 630 Woodhollow Ln
- 1327 Larchmont Dr
- 1272 Sandhurst Dr
- 131 Autumn Ct Unit CT10602
- 12 Cloverdale Ct
- 690 Dunhill Dr
- 5107 N Arlington Heights Rd
- 412 Chateau Dr
- 1325 Fairfax Ln
- 5135 Bridlewood Ct
- 1117 Franklin Ln Unit C52
- 153 E Fabish Dr
- 728 Old Checker Rd Unit C4
- 268 Hoffmann Dr
- 1175 Green Knolls Dr
- 1159 Green Knolls Dr
- 1183 Green Knolls Dr
- 1158 Green Knolls Dr
- 1191 Green Knolls Dr
- 1170 Green Knolls Dr
- 1182 Green Knolls Dr
- 1203 Green Knolls Dr
- 1190 Green Knolls Dr
- 1101 Gail Dr
- 1131 Gail Dr
- 1119 Gail Dr
- 1211 Green Knolls Dr
- 1143 Gail Dr
- 1198 Green Knolls Dr
- 1151 Gail Dr
- 1219 Green Knolls Dr
- 1159 Gail Dr
- 1206 Green Knolls Dr
- 1167 Gail Dr