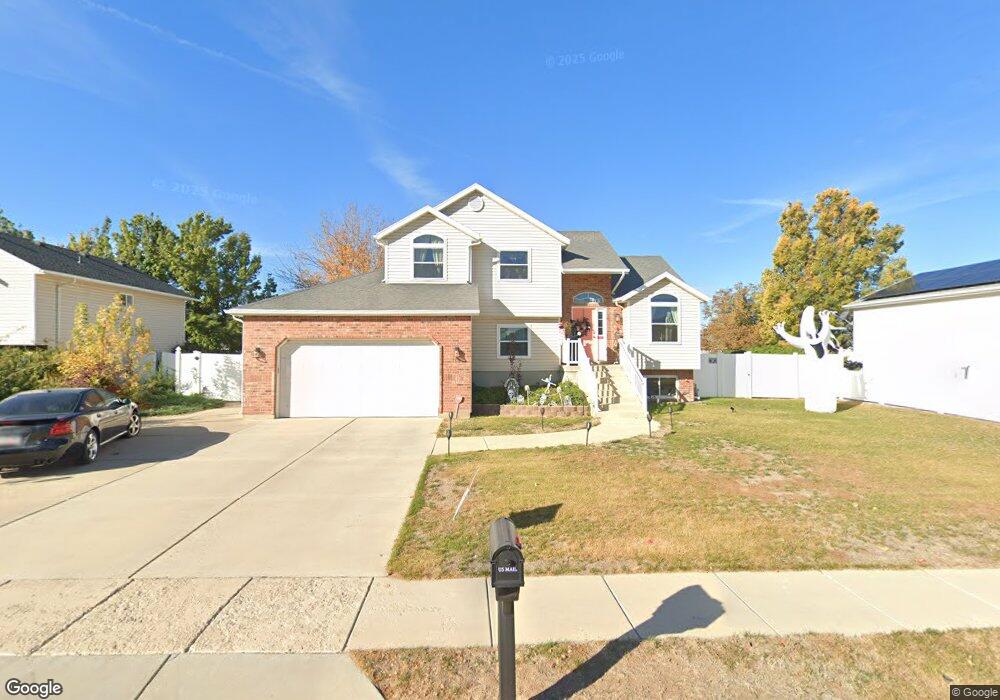
1167 N 3050 W Clearfield, UT 84015
Estimated Value: $475,000 - $536,000
3
Beds
3
Baths
2,500
Sq Ft
$199/Sq Ft
Est. Value
About This Home
This home is located at 1167 N 3050 W, Clearfield, UT 84015 and is currently estimated at $498,233, approximately $199 per square foot. 1167 N 3050 W is a home located in Davis County with nearby schools including Lakeside School, West Point Junior High School, and Syracuse High School.
Ownership History
Date
Name
Owned For
Owner Type
Purchase Details
Closed on
May 27, 1998
Sold by
Symmetry Development Inc
Bought by
Christensen Kevin S and Hardee Christina M
Current Estimated Value
Home Financials for this Owner
Home Financials are based on the most recent Mortgage that was taken out on this home.
Original Mortgage
$99,000
Outstanding Balance
$18,842
Interest Rate
7.13%
Estimated Equity
$479,391
Purchase Details
Closed on
Dec 31, 1996
Sold by
New Hampton Manor Associates
Bought by
Wsp Investments
Create a Home Valuation Report for This Property
The Home Valuation Report is an in-depth analysis detailing your home's value as well as a comparison with similar homes in the area
Home Values in the Area
Average Home Value in this Area
Purchase History
| Date | Buyer | Sale Price | Title Company |
|---|---|---|---|
| Christensen Kevin S | -- | Bonneville Title Company | |
| Symmetry Development Inc | -- | Bonneville Title Company Inc | |
| Wsp Investments | -- | Security Title Company |
Source: Public Records
Mortgage History
| Date | Status | Borrower | Loan Amount |
|---|---|---|---|
| Open | Christensen Kevin S | $99,000 |
Source: Public Records
Tax History Compared to Growth
Tax History
| Year | Tax Paid | Tax Assessment Tax Assessment Total Assessment is a certain percentage of the fair market value that is determined by local assessors to be the total taxable value of land and additions on the property. | Land | Improvement |
|---|---|---|---|---|
| 2025 | $2,623 | $245,850 | $102,344 | $143,506 |
| 2024 | $2,489 | $234,300 | $92,191 | $142,109 |
| 2023 | $2,298 | $398,000 | $111,836 | $286,164 |
| 2022 | $2,466 | $233,750 | $57,333 | $176,417 |
| 2021 | $2,264 | $321,000 | $92,874 | $228,126 |
| 2020 | $1,987 | $278,000 | $77,414 | $200,586 |
| 2019 | $1,928 | $266,000 | $75,287 | $190,713 |
| 2018 | $1,757 | $239,000 | $76,637 | $162,363 |
| 2016 | $1,539 | $110,110 | $29,593 | $80,517 |
| 2015 | $1,480 | $100,320 | $29,593 | $70,727 |
| 2014 | $1,472 | $101,244 | $29,593 | $71,651 |
| 2013 | -- | $83,758 | $25,850 | $57,908 |
Source: Public Records
Map
Nearby Homes