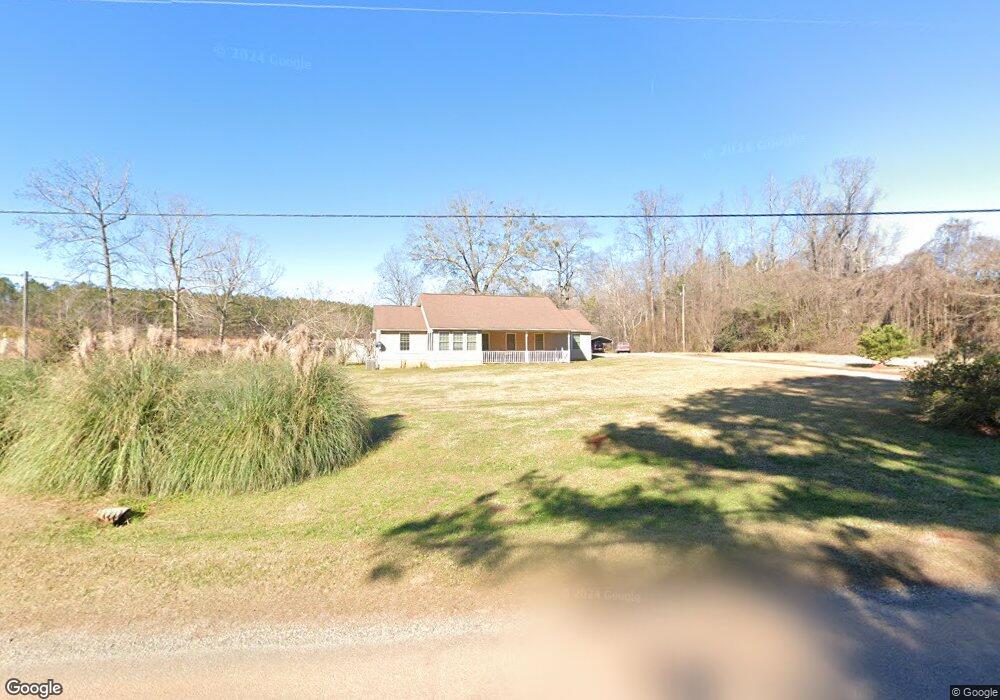
1167 Weems Rd Molena, GA 30258
Estimated Value: $252,000 - $394,000
3
Beds
2
Baths
2,184
Sq Ft
$150/Sq Ft
Est. Value
About This Home
This home is located at 1167 Weems Rd, Molena, GA 30258 and is currently estimated at $328,371, approximately $150 per square foot. 1167 Weems Rd is a home located in Upson County with nearby schools including Upson-Lee South Elementary School, Upson-Lee North Elementary School, and Upson-Lee Middle School.
Ownership History
Date
Name
Owned For
Owner Type
Purchase Details
Closed on
Sep 16, 2022
Sold by
Fallin Curtis Derek
Bought by
Fallin Salena Rose
Current Estimated Value
Home Financials for this Owner
Home Financials are based on the most recent Mortgage that was taken out on this home.
Original Mortgage
$272,700
Outstanding Balance
$117,516
Interest Rate
5.13%
Mortgage Type
Mortgage Modification
Estimated Equity
$210,855
Purchase Details
Closed on
Feb 19, 2021
Sold by
Fallin Curtis Randy
Bought by
Fallin Curtis Derek
Purchase Details
Closed on
Jun 28, 2017
Sold by
Fallin Debra K
Bought by
Fallin Curtis Randy
Purchase Details
Closed on
Mar 12, 2012
Sold by
Fallin Curtis R
Bought by
Fallin Debra K
Home Financials for this Owner
Home Financials are based on the most recent Mortgage that was taken out on this home.
Original Mortgage
$52,573
Interest Rate
3.89%
Mortgage Type
New Conventional
Create a Home Valuation Report for This Property
The Home Valuation Report is an in-depth analysis detailing your home's value as well as a comparison with similar homes in the area
Home Values in the Area
Average Home Value in this Area
Purchase History
| Date | Buyer | Sale Price | Title Company |
|---|---|---|---|
| Fallin Salena Rose | $250,000 | -- | |
| Fallin Curtis Derek | -- | -- | |
| Fallin Curtis Randy | -- | -- | |
| Fallin Debra K | -- | -- |
Source: Public Records
Mortgage History
| Date | Status | Borrower | Loan Amount |
|---|---|---|---|
| Open | Fallin Salena Rose | $272,700 | |
| Previous Owner | Fallin Debra K | $52,573 |
Source: Public Records
Tax History Compared to Growth
Tax History
| Year | Tax Paid | Tax Assessment Tax Assessment Total Assessment is a certain percentage of the fair market value that is determined by local assessors to be the total taxable value of land and additions on the property. | Land | Improvement |
|---|---|---|---|---|
| 2024 | $2,653 | $99,181 | $7,497 | $91,684 |
| 2023 | $2,605 | $95,085 | $7,497 | $87,588 |
| 2022 | $2,370 | $85,458 | $6,183 | $79,275 |
| 2021 | $1,791 | $76,495 | $6,183 | $70,312 |
| 2020 | $1,810 | $72,489 | $5,436 | $67,053 |
| 2019 | $1,789 | $66,470 | $5,436 | $61,034 |
| 2018 | $1,790 | $66,470 | $5,436 | $61,034 |
| 2017 | $2,129 | $63,318 | $5,436 | $57,882 |
| 2016 | $2,121 | $62,040 | $4,530 | $57,510 |
| 2015 | $2,121 | $62,040 | $4,530 | $57,510 |
| 2014 | $2,179 | $63,631 | $6,598 | $57,033 |
Source: Public Records
Map
Nearby Homes
- 000 (948) Smyrna Church Rd
- L-2 Smyrna Church Rd
- Lot 15 Weems Rd
- 2943 Weems Rd
- 948 Smyrna Church Rd
- 1138 Smyrna Church Rd
- 5019 Ga Hwy 109
- 5962 Ga Hwy 109
- 6060 Ga Highway 109
- 4326 Ga Highway 109
- 3840 Kings Rd
- 0 Hamp Smith Rd Unit 10626396
- 3115 Old Lifsey Springs Rd
- 3197 Old Lifsey Springs Rd
- 3243 Old Lifsey Springs Rd
- 1044 Union School Rd
- 101 Trent Jones Cir
- 2037 Jeff Davis Rd
- 325 Rain Valley Cir
- 1600 Firetower Rd
- 1295 Weems Rd
- 1158 Weems Rd
- 1196 Weems Rd
- 672 Smyrna Church Rd
- 650 Smyrna Church Rd
- 738 Smyrna Church Rd
- 650 Smyrna Church Rd
- 543 Smyrna Church Rd
- 1511 Weems Rd
- 1202 Weems Rd
- 1509 Weems Rd
- 735 Smyrna Church Rd
- 1517 Weems Rd
- 697 Smyrna Church Rd
- 1206 Weems Rd
- 784 Smyrna Church Rd
- 577 Smyrna Church Rd
- 560 Smyrna Church Rd
- 1579 Weems Rd
- 611 Gibson Rd