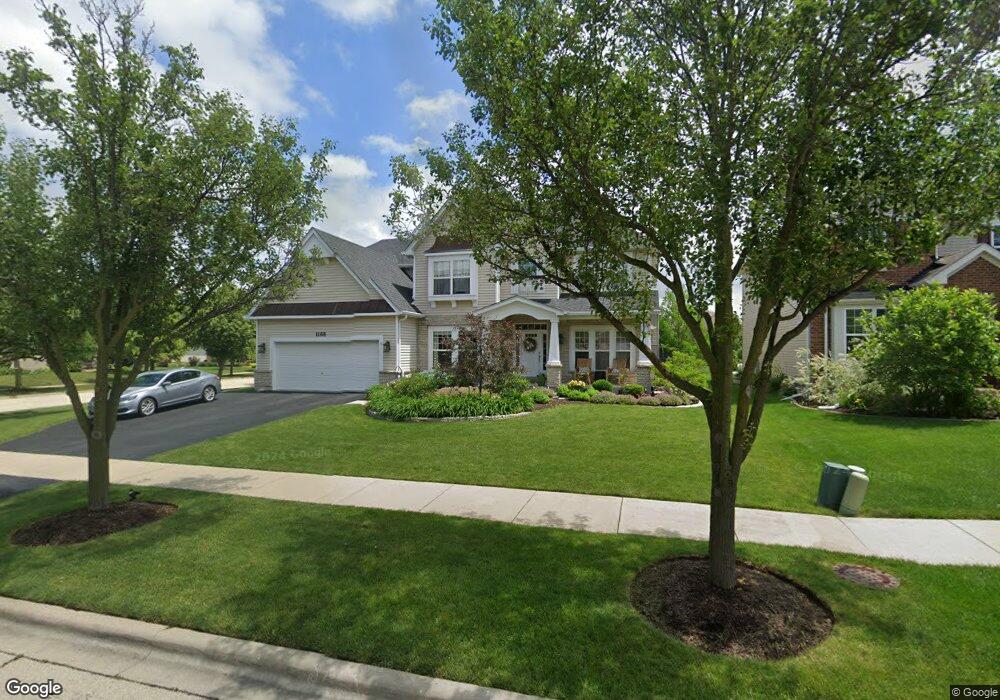
1168 Stonehaven Cir Unit 1 Aurora, IL 60504
Far East NeighborhoodEstimated Value: $542,000 - $785,000
4
Beds
4
Baths
3,308
Sq Ft
$207/Sq Ft
Est. Value
About This Home
This home is located at 1168 Stonehaven Cir Unit 1, Aurora, IL 60504 and is currently estimated at $685,336, approximately $207 per square foot. 1168 Stonehaven Cir Unit 1 is a home located in DuPage County with nearby schools including Owen Elementary School, Still Middle School, and Waubonsie Valley High School.
Ownership History
Date
Name
Owned For
Owner Type
Purchase Details
Closed on
Mar 8, 2024
Sold by
Bennett Andrew P and Bennett Jennifer W
Bought by
Bennett Family 2024 Declaration Of Trust and Bennett
Current Estimated Value
Purchase Details
Closed on
Jun 27, 2014
Sold by
Stefani & Sons Development Co Inc
Bought by
Freeborn & Peters Llp
Purchase Details
Closed on
Dec 10, 2004
Sold by
Stefani & Sons Development Co Inc
Bought by
Bennett Andrew P and Bennett Jennifer W
Home Financials for this Owner
Home Financials are based on the most recent Mortgage that was taken out on this home.
Original Mortgage
$376,450
Interest Rate
4.62%
Mortgage Type
Purchase Money Mortgage
Purchase Details
Closed on
Oct 14, 2003
Sold by
Us Bank Na
Bought by
Stefani & Sons Development Co
Home Financials for this Owner
Home Financials are based on the most recent Mortgage that was taken out on this home.
Original Mortgage
$3,996,802
Interest Rate
5.91%
Mortgage Type
Purchase Money Mortgage
Create a Home Valuation Report for This Property
The Home Valuation Report is an in-depth analysis detailing your home's value as well as a comparison with similar homes in the area
Home Values in the Area
Average Home Value in this Area
Purchase History
| Date | Buyer | Sale Price | Title Company |
|---|---|---|---|
| Bennett Family 2024 Declaration Of Trust | -- | None Listed On Document | |
| Freeborn & Peters Llp | -- | None Available | |
| Bennett Andrew P | $502,000 | Ctic | |
| Stefani & Sons Development Co | $4,702,500 | Ctic |
Source: Public Records
Mortgage History
| Date | Status | Borrower | Loan Amount |
|---|---|---|---|
| Previous Owner | Bennett Andrew P | $376,450 | |
| Previous Owner | Stefani & Sons Development Co | $3,996,802 | |
| Closed | Bennett Andrew P | $75,250 |
Source: Public Records
Tax History
| Year | Tax Paid | Tax Assessment Tax Assessment Total Assessment is a certain percentage of the fair market value that is determined by local assessors to be the total taxable value of land and additions on the property. | Land | Improvement |
|---|---|---|---|---|
| 2024 | $14,578 | $199,732 | $45,874 | $153,858 |
| 2023 | $13,935 | $179,470 | $41,220 | $138,250 |
| 2022 | $13,789 | $170,430 | $38,830 | $131,600 |
| 2021 | $13,432 | $164,340 | $37,440 | $126,900 |
| 2020 | $13,597 | $164,340 | $37,440 | $126,900 |
| 2019 | $13,131 | $156,310 | $35,610 | $120,700 |
| 2018 | $14,232 | $167,130 | $37,890 | $129,240 |
| 2017 | $14,007 | $161,460 | $36,600 | $124,860 |
| 2016 | $13,772 | $154,950 | $35,120 | $119,830 |
| 2015 | $13,652 | $147,130 | $33,350 | $113,780 |
| 2014 | $12,932 | $135,790 | $30,540 | $105,250 |
| 2013 | $12,796 | $136,730 | $30,750 | $105,980 |
Source: Public Records
Map
Nearby Homes
- 4474 Chelsea Manor Cir
- 4029 Broadmoor Cir
- 4429 Chelsea Manor Cir
- 1348 Amaranth Dr
- 4263 Stableford Ln
- 4167 Chelsea Manor Cir
- 4005 White Eagle Dr
- 3819 Cadella Cir
- 4110 Chelsea Manor Cir
- 4122 Chelsea Manor Cir
- 4204 Chelsea Manor Cir
- 4139 Winslow Ct
- 4177 Irving Rd
- 4196 Irving Rd
- 4158 Irving Rd
- 857 Finley Dr
- 4203 Calder Ln
- 3730 Baybrook Dr Unit 26
- 4213 Calder Ln
- 1576 Pine Lake Dr
- 1176 Stonehaven Cir
- 4135 Bedford Ln
- 1152 Stonehaven Cir Unit 1
- 4145 Bedford Ln Unit 1
- 1208 Stonehaven Cir
- 1165 Stonehaven Cir
- 1173 Stonehaven Cir
- 1232 Stonehaven Cir
- 1181 Stonehaven Cir
- 1248 Stonehaven Cir
- 1157 Stonehaven Cir Unit 1
- 1256 Stonehaven Cir
- 4155 Bedford Ln
- 1144 Stonehaven Cir Unit 1
- 4152 Bedford Ln
- 1189 Stonehaven Cir
- 1264 Stonehaven Cir
- 1149 Stonehaven Cir
- 1214 Amaranth Dr
- 1272 Stonehaven Cir
Your Personal Tour Guide
Ask me questions while you tour the home.