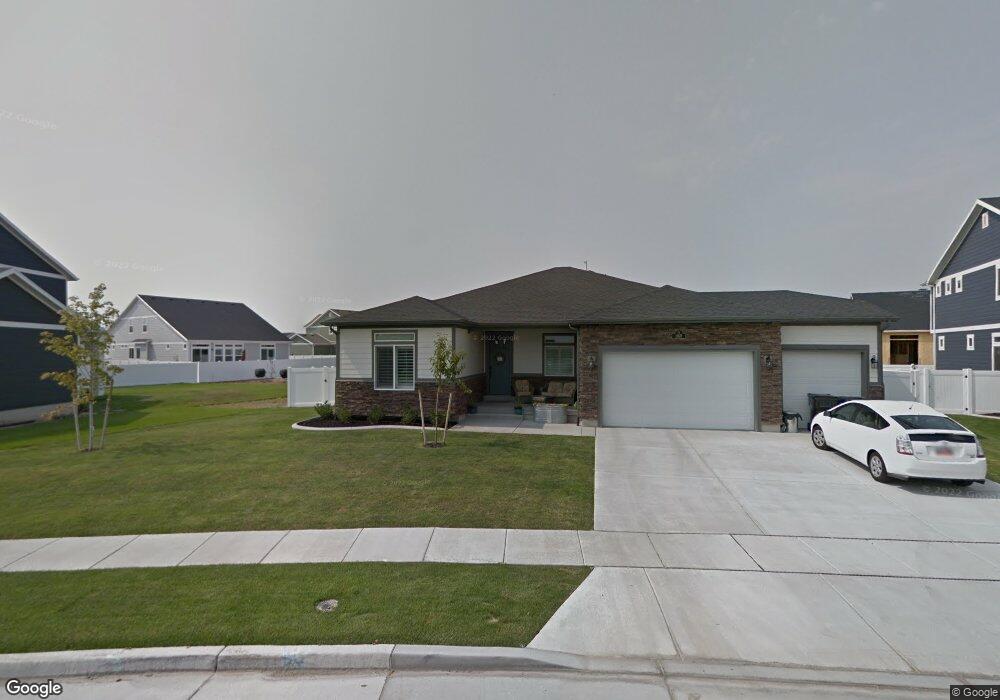
1168 W Tivoli Way Syracuse, UT 84075
Estimated Value: $647,000 - $726,000
5
Beds
3
Baths
3,651
Sq Ft
$188/Sq Ft
Est. Value
About This Home
This home is located at 1168 W Tivoli Way, Syracuse, UT 84075 and is currently estimated at $684,859, approximately $187 per square foot. 1168 W Tivoli Way is a home located in Davis County with nearby schools including Cook School, Legacy Junior High School, and Clearfield High School.
Ownership History
Date
Name
Owned For
Owner Type
Purchase Details
Closed on
Sep 24, 2020
Sold by
Hallsten Michelle
Bought by
Dickson Joshua H and Dickson Tina S
Current Estimated Value
Home Financials for this Owner
Home Financials are based on the most recent Mortgage that was taken out on this home.
Original Mortgage
$425,374
Outstanding Balance
$377,491
Interest Rate
2.9%
Mortgage Type
New Conventional
Estimated Equity
$307,368
Purchase Details
Closed on
Nov 20, 2017
Sold by
Clayton Properties Group Ii
Bought by
Hallsten Michelle
Home Financials for this Owner
Home Financials are based on the most recent Mortgage that was taken out on this home.
Original Mortgage
$366,428
Interest Rate
3.85%
Mortgage Type
New Conventional
Purchase Details
Closed on
Jul 3, 2017
Sold by
Oakwood Homes Of Utah Llc
Bought by
Clayton Properties Group Ii Inc
Create a Home Valuation Report for This Property
The Home Valuation Report is an in-depth analysis detailing your home's value as well as a comparison with similar homes in the area
Home Values in the Area
Average Home Value in this Area
Purchase History
| Date | Buyer | Sale Price | Title Company |
|---|---|---|---|
| Dickson Joshua H | -- | First American Title | |
| Hallsten Michelle | -- | -- | |
| Clayton Properties Group Ii Inc | -- | Cottonwood Title |
Source: Public Records
Mortgage History
| Date | Status | Borrower | Loan Amount |
|---|---|---|---|
| Open | Dickson Joshua H | $425,374 | |
| Previous Owner | Hallsten Michelle | $366,428 |
Source: Public Records
Tax History Compared to Growth
Tax History
| Year | Tax Paid | Tax Assessment Tax Assessment Total Assessment is a certain percentage of the fair market value that is determined by local assessors to be the total taxable value of land and additions on the property. | Land | Improvement |
|---|---|---|---|---|
| 2025 | $3,820 | $368,500 | $122,286 | $246,214 |
| 2024 | $3,754 | $364,650 | $98,648 | $266,002 |
| 2023 | $3,520 | $623,000 | $137,595 | $485,405 |
| 2022 | $3,696 | $358,600 | $79,544 | $279,056 |
| 2021 | $3,475 | $522,000 | $117,268 | $404,732 |
| 2020 | $2,792 | $406,000 | $103,399 | $302,601 |
| 2019 | $2,696 | $387,000 | $99,547 | $287,453 |
| 2018 | $2,526 | $360,000 | $96,955 | $263,045 |
| 2016 | $907 | $67,763 | $67,763 | $0 |
Source: Public Records
Map
Nearby Homes
- 1153 W 1875 S
- 1142 W 2050 S
- 992 W 1910 S
- 1148 W 2050 S
- 1079 W 2050 S
- 929 W 1920 S Unit A
- 1154 W 1700 S
- 891 W 1840 S Unit A
- 891 W 1920 S Unit C
- 877 W 1920 S Unit C
- 1622 S 1000 W
- 2232 S 1000 W
- 936 W 2225 S
- Stetson Plan at Wilcox Farms
- Caldwell Plan at Wilcox Farms
- Everglade Plan at Wilcox Farms
- Echo Plan at Wilcox Farms
- Granite Plan at Wilcox Farms
- 1553 S 900 W
- 1553 S 900 W Unit 139
- 1144 W Tivoli Way
- 1182 W Tivoli Way
- 1179 W 1875 S
- 1187 W 1875 S
- 1153 W 1875 S Unit 223
- 1149 W Tivoli Way
- 1120 W Tivoli Way
- 1907 S 1200 W
- 1906 S 1100 W Unit 120
- 1127 W 1875 S
- 1913 S 1200 W
- 1879 S 1200 W
- 1179 W Tivoli Way
- 1912 S 1100 W
- 1172 W 1875 S
- 1189 W Tivoli Way
- 1186 W 1875 S
- 1918 S 1100 W
- 1194 W 1875 S
- 1094 W Tivoli Way