Estimated Value: $192,078 - $225,000
2
Beds
1
Bath
872
Sq Ft
$236/Sq Ft
Est. Value
About This Home
This home is located at 11680 Walnut Dowler Rd, Logan, OH 43138 and is currently estimated at $205,520, approximately $235 per square foot. 11680 Walnut Dowler Rd is a home located in Hocking County with nearby schools including Chieftain Elementary School, St. John the Evangelist School, and Logan Christian School.
Ownership History
Date
Name
Owned For
Owner Type
Purchase Details
Closed on
Oct 9, 2008
Sold by
Fifth Third Mortgage Co
Bought by
Bantigue Chenvan
Current Estimated Value
Home Financials for this Owner
Home Financials are based on the most recent Mortgage that was taken out on this home.
Original Mortgage
$64,285
Interest Rate
6.49%
Mortgage Type
New Conventional
Purchase Details
Closed on
Sep 30, 2005
Sold by
Mohler J Israel and Mohler Missy M
Bought by
Eden Joshua Alan and Eden Jennifer Renee
Home Financials for this Owner
Home Financials are based on the most recent Mortgage that was taken out on this home.
Original Mortgage
$89,900
Interest Rate
5.83%
Mortgage Type
Purchase Money Mortgage
Purchase Details
Closed on
May 19, 2005
Sold by
Wells Fargo Bank Minnesota Na
Bought by
Mohler J Israel and Mohler Missy M
Create a Home Valuation Report for This Property
The Home Valuation Report is an in-depth analysis detailing your home's value as well as a comparison with similar homes in the area
Purchase History
| Date | Buyer | Sale Price | Title Company |
|---|---|---|---|
| Bantigue Chenvan | $63,000 | None Available | |
| Eden Joshua Alan | -- | None Available | |
| Mohler J Israel | $38,000 | None Available |
Source: Public Records
Mortgage History
| Date | Status | Borrower | Loan Amount |
|---|---|---|---|
| Previous Owner | Bantigue Chenvan | $64,285 | |
| Previous Owner | Eden Joshua Alan | $89,900 |
Source: Public Records
Tax History
| Year | Tax Paid | Tax Assessment Tax Assessment Total Assessment is a certain percentage of the fair market value that is determined by local assessors to be the total taxable value of land and additions on the property. | Land | Improvement |
|---|---|---|---|---|
| 2024 | $1,280 | $29,600 | $13,490 | $16,110 |
| 2023 | $1,114 | $29,600 | $13,490 | $16,110 |
| 2022 | $1,116 | $29,600 | $13,490 | $16,110 |
| 2021 | $1,131 | $28,150 | $9,630 | $18,520 |
| 2020 | $1,126 | $28,150 | $9,630 | $18,520 |
| 2019 | $1,126 | $28,150 | $9,630 | $18,520 |
| 2018 | $1,039 | $26,560 | $8,040 | $18,520 |
| 2017 | $1,019 | $26,560 | $8,040 | $18,520 |
| 2016 | $1,012 | $26,560 | $8,040 | $18,520 |
| 2015 | $873 | $22,100 | $8,440 | $13,660 |
| 2014 | $873 | $22,100 | $8,440 | $13,660 |
| 2013 | $876 | $22,100 | $8,440 | $13,660 |
Source: Public Records
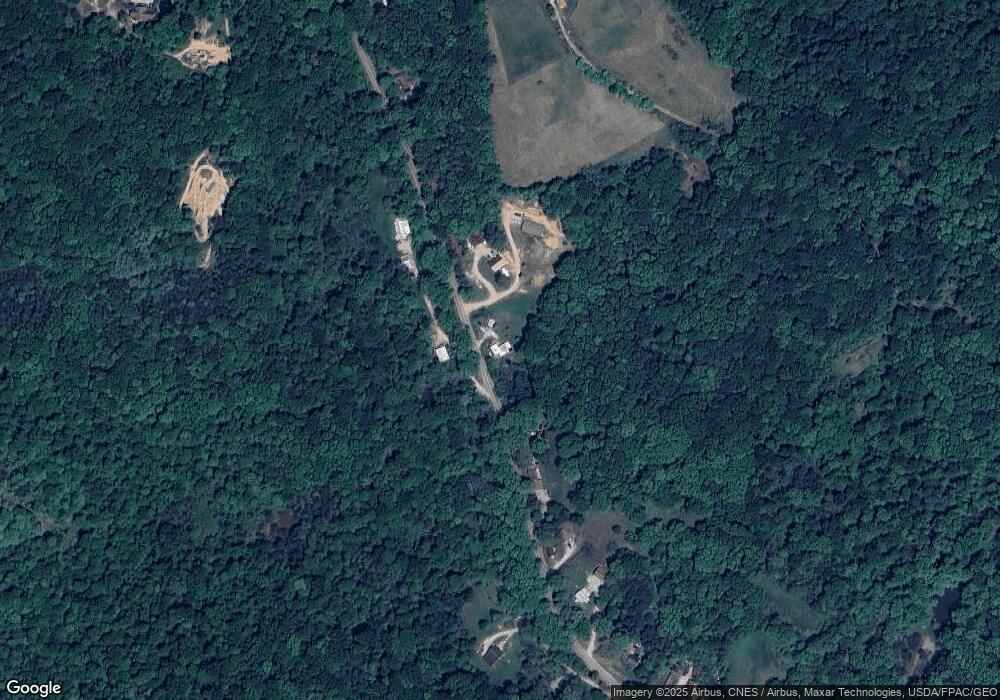
Map
Nearby Homes
- 260 Angle W Ave
- 48 Hill St
- 394 Church St
- 1030 3rd St
- 75 Hill St
- 171 Warner Ave
- 171 West St
- 385 W Main St
- 0 Ohio 664 Unit Lot 10
- 0 Ohio 664
- 331 Short St
- 0 Walnut Dowler Rd Unit 225043922
- 226 W Front St
- State Route 328
- 680 E Hunter St
- 600 E 2nd St
- 1233 Ohio Ave
- 31740 Huston Rd
- 882 E Main St
- 743 Summit Dr
- 11640 Walnut Dowler Rd
- 11750 Walnut Dowler Rd
- 11693 Walnut Dowler Rd
- 11780 Walnut Dowler Rd
- 11550 Walnut Dowler Rd
- 11820 Walnut Dowler Rd
- 11860 Walnut Dowler Rd
- 11824 Walnut Dowler Rd
- 11510 Walnut Dowler Rd
- 10726 Walnut Dowler Rd
- 103 Ac Walnut Dowler Rd
- South Lot Walnut Dowler Rd
- North Lot Walnut Dowler Rd
- 11400 Walnut Dowler Rd
- O Walnut Dowler Rd Unit LOT9
- O Walnut Dowler Rd Unit LOT8
- O Walnut Dowler Rd
- O Walnut Dowler Rd Unit LOT3
- 9999 Walnut Dowler Rd
- 11480 Walnut Dowler Rd
Your Personal Tour Guide
Ask me questions while you tour the home.