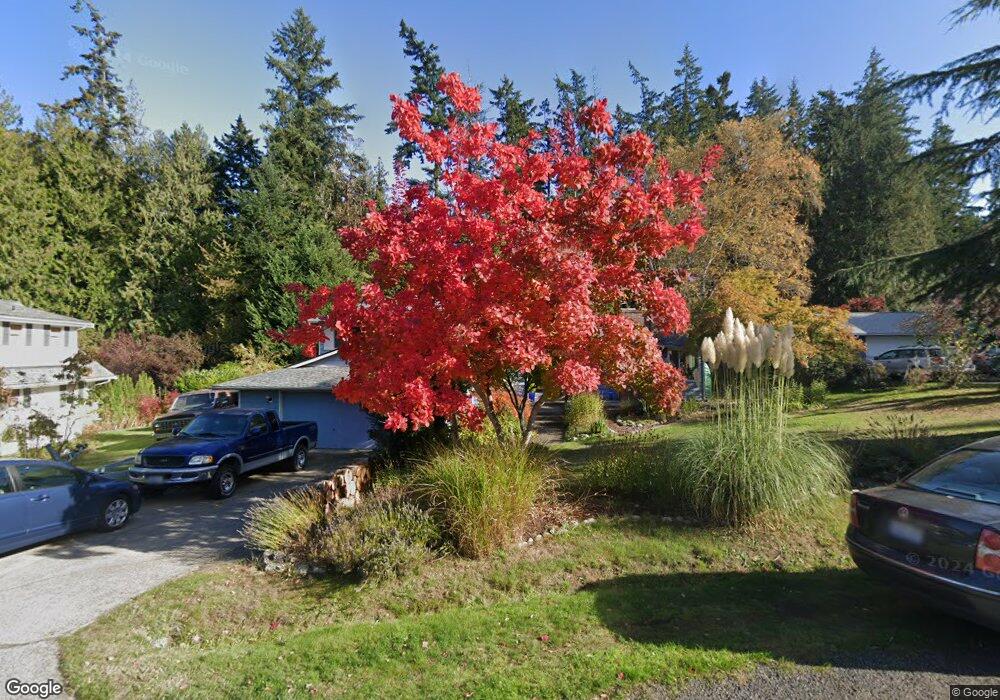
11685 NE Sunset Loop Bainbridge Island, WA 98110
Estimated Value: $983,517 - $1,287,000
3
Beds
3
Baths
2,442
Sq Ft
$450/Sq Ft
Est. Value
About This Home
This home is located at 11685 NE Sunset Loop, Bainbridge Island, WA 98110 and is currently estimated at $1,098,379, approximately $449 per square foot. 11685 NE Sunset Loop is a home located in Kitsap County with nearby schools including Bainbridge High School, St. Cecilia Catholic School, and Carden Country School.
Ownership History
Date
Name
Owned For
Owner Type
Purchase Details
Closed on
Jul 30, 2002
Sold by
Garrett Darrin and Garrett Melissa
Bought by
Trapp Mark W and Trapp Joy E
Current Estimated Value
Home Financials for this Owner
Home Financials are based on the most recent Mortgage that was taken out on this home.
Original Mortgage
$284,000
Outstanding Balance
$120,604
Interest Rate
6.6%
Estimated Equity
$977,775
Purchase Details
Closed on
Jun 15, 2001
Sold by
Pasley John Robert
Bought by
Garrett Darrin and Garrett Melissa
Home Financials for this Owner
Home Financials are based on the most recent Mortgage that was taken out on this home.
Original Mortgage
$207,000
Interest Rate
7.15%
Purchase Details
Closed on
Mar 16, 2001
Sold by
Pasley John Robert and Pasley Family Revocable Living
Bought by
Pasley John Robert
Purchase Details
Closed on
Apr 15, 1997
Sold by
Pasley John Robert and Pasley Mary Edith
Bought by
Pasley John R and Pasley Family Revocable Living
Create a Home Valuation Report for This Property
The Home Valuation Report is an in-depth analysis detailing your home's value as well as a comparison with similar homes in the area
Home Values in the Area
Average Home Value in this Area
Purchase History
| Date | Buyer | Sale Price | Title Company |
|---|---|---|---|
| Trapp Mark W | $299,000 | First American Title Ins | |
| Garrett Darrin | $279,500 | Land Title Company | |
| Pasley John Robert | -- | -- | |
| Pasley John R | -- | -- |
Source: Public Records
Mortgage History
| Date | Status | Borrower | Loan Amount |
|---|---|---|---|
| Open | Trapp Mark W | $284,000 | |
| Previous Owner | Garrett Darrin | $207,000 |
Source: Public Records
Tax History Compared to Growth
Tax History
| Year | Tax Paid | Tax Assessment Tax Assessment Total Assessment is a certain percentage of the fair market value that is determined by local assessors to be the total taxable value of land and additions on the property. | Land | Improvement |
|---|---|---|---|---|
| 2026 | $6,453 | $788,030 | $242,800 | $545,230 |
| 2025 | $6,453 | $788,030 | $242,800 | $545,230 |
| 2024 | $6,430 | $788,030 | $242,800 | $545,230 |
| 2023 | $6,430 | $788,030 | $242,800 | $545,230 |
| 2022 | $5,945 | $620,570 | $191,520 | $429,050 |
| 2021 | $5,833 | $580,820 | $179,330 | $401,490 |
| 2020 | $5,490 | $538,100 | $165,910 | $372,190 |
| 2019 | $5,042 | $503,000 | $154,930 | $348,070 |
| 2018 | $4,913 | $397,690 | $121,990 | $275,700 |
| 2017 | $4,214 | $397,690 | $121,990 | $275,700 |
| 2016 | $4,615 | $416,230 | $121,990 | $294,240 |
| 2015 | $4,119 | $377,850 | $121,990 | $255,860 |
| 2014 | -- | $344,960 | $121,990 | $222,970 |
| 2013 | -- | $344,960 | $121,990 | $222,970 |
Source: Public Records
Map
Nearby Homes
- 11665 NE Sunset Loop
- 11925 Manzanita Ln NE
- 7870 NE Koura Farm Dr
- 11186 Blue Pond Place NE
- 6564 NE Maple St
- 13098 Manzanita Rd NE
- 10218 Affirmed Ln NE
- 12170 Viewcrest Place NE
- 12145 Arrow Point Loop NE
- 12168 Viewcrest Place NE
- 13401 Manzanita Rd NE
- 11000 Xx State Hwy 305 NE
- 0 NE Lovgreen Rd E Unit NWM2419912
- 13978 Hidden Heights Ln NE
- 9488 Katherine Place NE
- 9631 Summer Hill Ln NE
- 9595 Windsong Loop NE
- 14157 Komedal Rd NE
- 8003 NE Hidden Cove Rd
- 10052 NE Winther Rd
- 11687 NE Sunset Loop
- 11681 NE Sunset Loop
- 11785 Penny Place NE
- 11689 NE Sunset Loop
- 11751 Penny Place NE
- 11677 NE Sunset Loop
- 11688 NE Sunset Loop
- 11821 Penny Place NE
- 7421 NE Olson Farm Ln
- 7421 NE Olsen Farm Ln
- 11668 NE Sunset Loop
- 7345 NE Olson Farm Ln
- 7410 NE Olsen Farm Ln
- 7468 NE Bay Hill Rd
- 11673 NE Sunset Loop
- 11694 NE Sunset Loop
- 11679 Penny Place NE
- 11843 Penny Place NE
- 7350 NE Olsen Farm Ln
- 11746 Penny Place NE