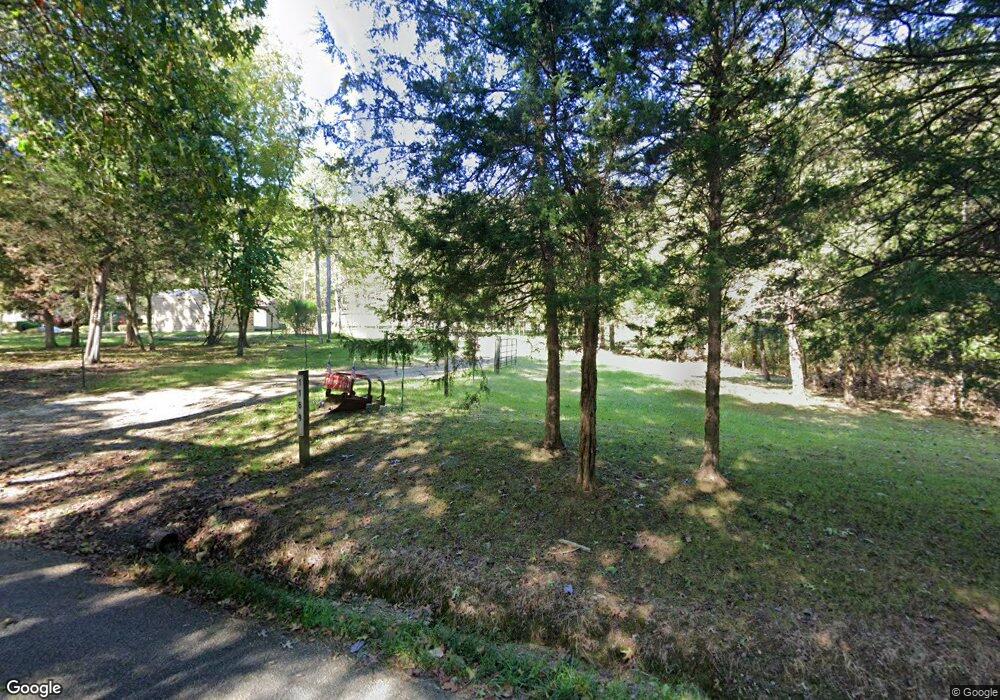
1169 Hamilton Rd Lynx, OH 45650
Estimated Value: $244,095 - $286,000
2
Beds
2
Baths
1,017
Sq Ft
$261/Sq Ft
Est. Value
About This Home
This home is located at 1169 Hamilton Rd, Lynx, OH 45650 and is currently estimated at $265,048, approximately $260 per square foot. 1169 Hamilton Rd is a home located in Adams County with nearby schools including West Union Elementary School and West Union High School.
Ownership History
Date
Name
Owned For
Owner Type
Purchase Details
Closed on
Oct 5, 2020
Sold by
Beers Sheri
Bought by
Sayre Dencil L
Current Estimated Value
Home Financials for this Owner
Home Financials are based on the most recent Mortgage that was taken out on this home.
Original Mortgage
$100,000
Outstanding Balance
$88,137
Interest Rate
2.9%
Mortgage Type
New Conventional
Estimated Equity
$176,911
Purchase Details
Closed on
Jan 13, 2017
Sold by
Dixon David A and Dixon Lora C
Bought by
Beers Sheri and Sayre Dencil L
Home Financials for this Owner
Home Financials are based on the most recent Mortgage that was taken out on this home.
Original Mortgage
$102,400
Interest Rate
4.13%
Mortgage Type
New Conventional
Purchase Details
Closed on
Mar 21, 2003
Sold by
Burr Howard R and Burr Margie P
Bought by
Burr Howard R and Burr Margie P
Purchase Details
Closed on
Dec 29, 1997
Sold by
Burr Howard R
Bought by
Burr Howard R and Burr Margie P
Purchase Details
Closed on
Jul 16, 1996
Bought by
Burr Howard R
Create a Home Valuation Report for This Property
The Home Valuation Report is an in-depth analysis detailing your home's value as well as a comparison with similar homes in the area
Purchase History
| Date | Buyer | Sale Price | Title Company |
|---|---|---|---|
| Sayre Dencil L | -- | None Available | |
| Beers Sheri | $128,000 | Technetitle Agency Inc | |
| Burr Howard R | -- | -- | |
| Burr Howard R | -- | -- | |
| Burr Howard R | -- | -- |
Source: Public Records
Mortgage History
| Date | Status | Borrower | Loan Amount |
|---|---|---|---|
| Open | Sayre Dencil L | $100,000 | |
| Previous Owner | Beers Sheri | $102,400 |
Source: Public Records
Tax History
| Year | Tax Paid | Tax Assessment Tax Assessment Total Assessment is a certain percentage of the fair market value that is determined by local assessors to be the total taxable value of land and additions on the property. | Land | Improvement |
|---|---|---|---|---|
| 2025 | $621 | $37,600 | $13,900 | $23,700 |
| 2024 | $621 | $37,600 | $13,900 | $23,700 |
| 2023 | $646 | $37,600 | $13,900 | $23,700 |
| 2022 | $655 | $28,990 | $11,170 | $17,820 |
| 2021 | $479 | $28,990 | $11,170 | $17,820 |
| 2020 | $827 | $28,990 | $11,170 | $17,820 |
| 2019 | $827 | $28,990 | $11,170 | $17,820 |
| 2018 | $705 | $24,960 | $9,450 | $15,510 |
| 2017 | $693 | $24,960 | $9,450 | $15,510 |
| 2016 | $692 | $24,960 | $9,450 | $15,510 |
| 2015 | $766 | $24,540 | $8,370 | $16,170 |
| 2014 | $766 | $24,540 | $8,370 | $16,170 |
Source: Public Records
Map
Nearby Homes
- 1186 Tulip Rd
- 500 Ernie Rd
- 1996 Randalls Run Rd
- 598 Ohio 348
- 467 Waggoner Riffle Rd
- 1805 Waggoner Riffle Rd
- 2603 Cassel Run Rd
- 0 Blue Creek Rd
- 4702 Brush Creek Rd
- 8.307 Ac Churn Creek Rd
- 526 Brush Creek Rd
- 117 L F Clock Dr
- 16033 U S Route 52
- 2030 Long Lick Rd
- 0 Blue Creek Rd Unit 11669945
- 18300 U S 52
- 4050 Poplar Ridge Rd
- 21070 U S 52
- 85 2nd St
- 3000 Route 8
- 1075 Hamilton Rd
- 1169 Hamilton Rd
- 86 Kathy Ln
- 1339 Hamilton Rd
- 929 Hamilton Rd
- 893 Hamilton Rd
- 1336 Hamilton Rd
- 1266 Hamilton Rd
- 827 Hamilton Rd
- 204 Kathy Ln
- 777 Hamilton Rd
- 249 Kathy Ln
- 750 Hamilton Rd
- 55 Annette Ln
- 759 Hamilton Rd
- 713 Hamilton Rd
- 1447 Hamilton Rd
- 303 Kathy Ln
- 454 Kathy Ln
- 279 Annette Ln
Your Personal Tour Guide
Ask me questions while you tour the home.