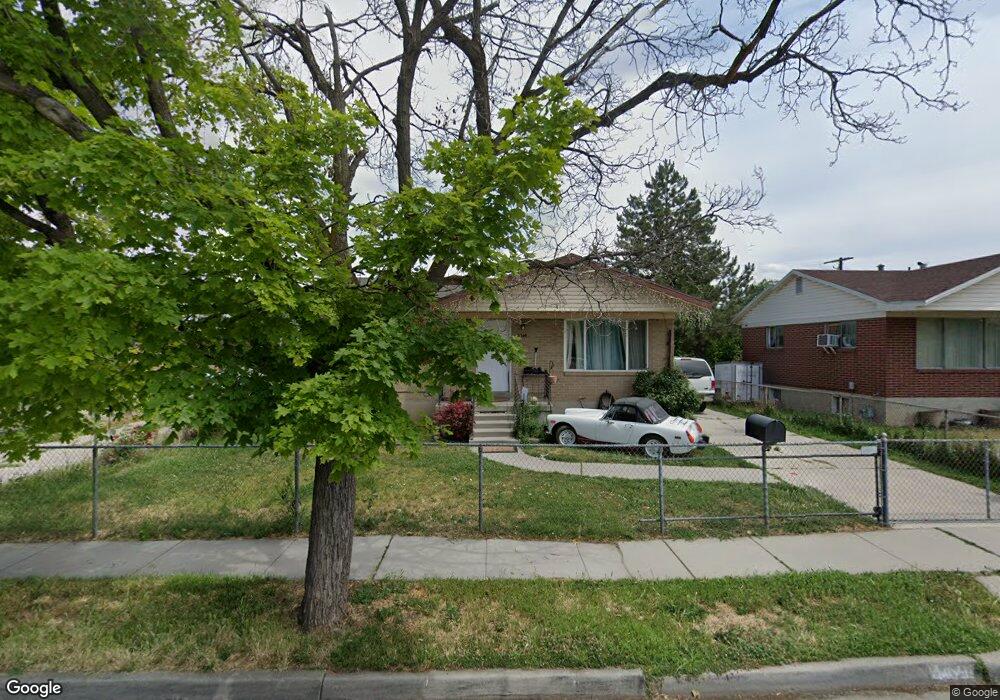
1169 Jeremy St Salt Lake City, UT 84104
Glendale NeighborhoodEstimated Value: $387,000 - $439,000
4
Beds
2
Baths
875
Sq Ft
$475/Sq Ft
Est. Value
About This Home
This home is located at 1169 Jeremy St, Salt Lake City, UT 84104 and is currently estimated at $415,960, approximately $475 per square foot. 1169 Jeremy St is a home located in Salt Lake County with nearby schools including Riley Elementary School, Glendale Middle, and Highland High School.
Ownership History
Date
Name
Owned For
Owner Type
Purchase Details
Closed on
Jul 5, 2007
Sold by
Schimming Robert W
Bought by
Nts Investments Llc
Current Estimated Value
Home Financials for this Owner
Home Financials are based on the most recent Mortgage that was taken out on this home.
Original Mortgage
$170,000
Outstanding Balance
$106,311
Interest Rate
6.51%
Mortgage Type
Purchase Money Mortgage
Estimated Equity
$309,649
Purchase Details
Closed on
Apr 3, 2002
Sold by
Dejong Teunis
Bought by
Dejong Teunis and Teunis Dejong Trust
Create a Home Valuation Report for This Property
The Home Valuation Report is an in-depth analysis detailing your home's value as well as a comparison with similar homes in the area
Home Values in the Area
Average Home Value in this Area
Purchase History
| Date | Buyer | Sale Price | Title Company |
|---|---|---|---|
| Nts Investments Llc | -- | Equity Title | |
| Dejong Teunis | -- | -- |
Source: Public Records
Mortgage History
| Date | Status | Borrower | Loan Amount |
|---|---|---|---|
| Open | Nts Investments Llc | $170,000 |
Source: Public Records
Tax History Compared to Growth
Tax History
| Year | Tax Paid | Tax Assessment Tax Assessment Total Assessment is a certain percentage of the fair market value that is determined by local assessors to be the total taxable value of land and additions on the property. | Land | Improvement |
|---|---|---|---|---|
| 2025 | $1,715 | $335,500 | $118,300 | $217,200 |
| 2024 | $1,715 | $327,300 | $112,000 | $215,300 |
| 2023 | $1,663 | $305,900 | $107,700 | $198,200 |
| 2022 | $1,784 | $307,800 | $105,600 | $202,200 |
| 2021 | $1,543 | $241,100 | $78,000 | $163,100 |
| 2020 | $1,066 | $158,500 | $64,700 | $93,800 |
| 2019 | $1,091 | $152,600 | $64,700 | $87,900 |
| 2018 | $0 | $142,100 | $64,700 | $77,400 |
| 2017 | $1,111 | $141,800 | $59,300 | $82,500 |
| 2016 | $1,101 | $133,500 | $49,800 | $83,700 |
| 2015 | $930 | $106,900 | $44,500 | $62,400 |
| 2014 | $885 | $100,900 | $43,400 | $57,500 |
Source: Public Records
Map
Nearby Homes
- 1075 S Jeremy St
- 1195 S 800 W
- 751 W Paxton Ave
- 1083 W Fremont Ave
- 938 W 1400 S
- 1361 S 1000 W
- 801 W Genesee Ave
- 1134 Illinois Ave
- 809 W 800 S
- 1229 S Emery St
- 1279 Emery St W
- 1540 S 900 W
- 1130 S 1200 W
- 757 S 1000 W
- 1590 S 900 W Unit 501
- 1590 S 900 W Unit 1003
- The Urban Plan at Regency on 9th
- The Metro Plan at Regency on 9th
- 1590 S 900 W Unit 302
- 1590 S 900 W Unit 203