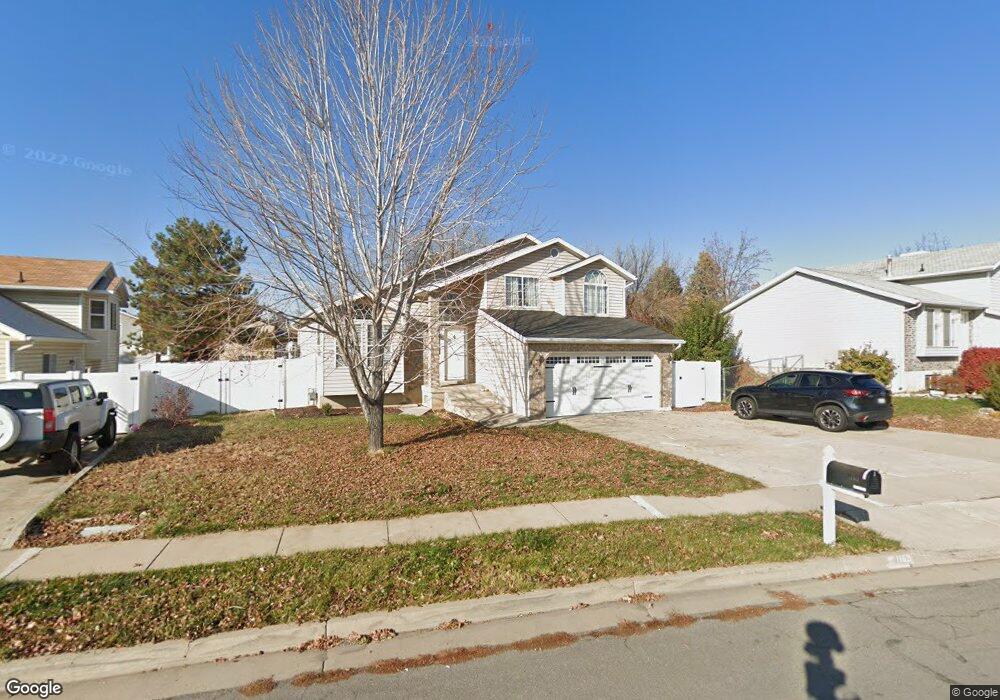
1169 N 100 W Layton, UT 84041
Estimated Value: $479,000 - $514,000
3
Beds
3
Baths
2,151
Sq Ft
$230/Sq Ft
Est. Value
About This Home
This home is located at 1169 N 100 W, Layton, UT 84041 and is currently estimated at $495,196, approximately $230 per square foot. 1169 N 100 W is a home located in Davis County with nearby schools including Crestview Elementary School, Central Davis Junior High School, and Northridge High School.
Ownership History
Date
Name
Owned For
Owner Type
Purchase Details
Closed on
Jan 14, 2021
Sold by
Morris Justin Tyler and Justin Morris Living Trust
Bought by
Morris Justin Tyler and Morris Tess Catherine
Current Estimated Value
Purchase Details
Closed on
Mar 19, 2019
Sold by
Morris Justin
Bought by
Morris Justin Tyler and Justin Morris Living Trust
Purchase Details
Closed on
Mar 28, 2018
Sold by
Williams Kody and Williams Leslee
Bought by
Morris Justin
Home Financials for this Owner
Home Financials are based on the most recent Mortgage that was taken out on this home.
Original Mortgage
$202,500
Outstanding Balance
$117,887
Interest Rate
4.43%
Mortgage Type
New Conventional
Estimated Equity
$377,309
Purchase Details
Closed on
Dec 19, 2012
Sold by
Hurley Todd J and Hurley Veronica S
Bought by
Branch Banking And Trust Co
Create a Home Valuation Report for This Property
The Home Valuation Report is an in-depth analysis detailing your home's value as well as a comparison with similar homes in the area
Home Values in the Area
Average Home Value in this Area
Purchase History
| Date | Buyer | Sale Price | Title Company |
|---|---|---|---|
| Morris Justin Tyler | -- | Sage Law Partners Llc | |
| Morris Justin Tyler | -- | None Available | |
| Morris Justin | -- | Lincoln Title | |
| Branch Banking And Trust Co | -- | None Available |
Source: Public Records
Mortgage History
| Date | Status | Borrower | Loan Amount |
|---|---|---|---|
| Open | Morris Justin | $202,500 |
Source: Public Records
Tax History Compared to Growth
Tax History
| Year | Tax Paid | Tax Assessment Tax Assessment Total Assessment is a certain percentage of the fair market value that is determined by local assessors to be the total taxable value of land and additions on the property. | Land | Improvement |
|---|---|---|---|---|
| 2025 | $2,400 | $251,900 | $96,945 | $154,955 |
| 2024 | $2,289 | $241,999 | $113,257 | $128,742 |
| 2023 | $2,280 | $233,750 | $75,588 | $158,161 |
| 2022 | $2,391 | $440,000 | $130,598 | $309,402 |
| 2021 | $2,180 | $329,000 | $98,582 | $230,418 |
| 2020 | $1,975 | $286,000 | $83,859 | $202,141 |
| 2019 | $1,925 | $273,000 | $80,484 | $192,516 |
| 2018 | $1,643 | $234,000 | $80,484 | $153,516 |
| 2016 | $1,510 | $110,880 | $25,122 | $85,758 |
| 2015 | $1,430 | $99,715 | $25,122 | $74,593 |
| 2014 | $1,436 | $102,403 | $25,122 | $77,281 |
| 2013 | -- | $96,730 | $25,325 | $71,405 |
Source: Public Records
Map
Nearby Homes