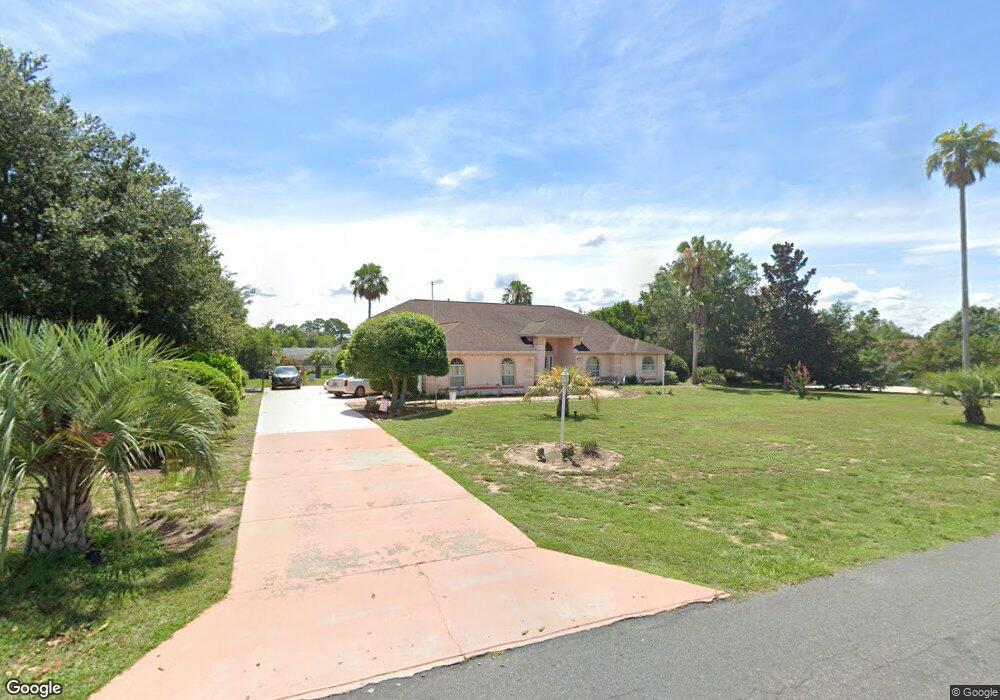
1169 N Cherry Pop Dr Hernando, FL 34442
Estimated Value: $455,465 - $607,000
3
Beds
2
Baths
2,634
Sq Ft
$199/Sq Ft
Est. Value
About This Home
This home is located at 1169 N Cherry Pop Dr, Hernando, FL 34442 and is currently estimated at $523,116, approximately $198 per square foot. 1169 N Cherry Pop Dr is a home located in Citrus County with nearby schools including Hernando Elementary School, Inverness Middle School, and Citrus High School.
Ownership History
Date
Name
Owned For
Owner Type
Purchase Details
Closed on
Jun 2, 2021
Sold by
Cortes Eduardo and Cortes Myriam
Bought by
Cortes Eduardo and Cortes Myriam
Current Estimated Value
Home Financials for this Owner
Home Financials are based on the most recent Mortgage that was taken out on this home.
Original Mortgage
$245,000
Outstanding Balance
$220,362
Interest Rate
2.9%
Mortgage Type
New Conventional
Estimated Equity
$302,754
Purchase Details
Closed on
Mar 3, 2003
Sold by
Theberge Cyrice E and Theberge Elizabeth M
Bought by
Cortes Eduardo and Cortes Myriam
Home Financials for this Owner
Home Financials are based on the most recent Mortgage that was taken out on this home.
Original Mortgage
$202,050
Interest Rate
5.74%
Purchase Details
Closed on
Oct 1, 1995
Bought by
Cortes Eduardo and Cortes Myriam
Purchase Details
Closed on
Feb 1, 1994
Bought by
Cortes Eduardo and Cortes Myriam
Purchase Details
Closed on
Feb 1, 1991
Bought by
Cortes Eduardo and Cortes Myriam
Create a Home Valuation Report for This Property
The Home Valuation Report is an in-depth analysis detailing your home's value as well as a comparison with similar homes in the area
Home Values in the Area
Average Home Value in this Area
Purchase History
| Date | Buyer | Sale Price | Title Company |
|---|---|---|---|
| Cortes Eduardo | -- | Timios Inc | |
| Cortes Eduardo | $269,400 | Manatee Title Co Inc | |
| Cortes Eduardo | $100 | -- | |
| Cortes Eduardo | $27,000 | -- | |
| Cortes Eduardo | $38,800 | -- |
Source: Public Records
Mortgage History
| Date | Status | Borrower | Loan Amount |
|---|---|---|---|
| Open | Cortes Eduardo | $245,000 | |
| Closed | Cortes Eduardo | $202,050 |
Source: Public Records
Tax History
| Year | Tax Paid | Tax Assessment Tax Assessment Total Assessment is a certain percentage of the fair market value that is determined by local assessors to be the total taxable value of land and additions on the property. | Land | Improvement |
|---|---|---|---|---|
| 2025 | $3,942 | $290,069 | -- | -- |
| 2024 | $3,956 | $296,275 | -- | -- |
| 2023 | $3,956 | $296,187 | $0 | $0 |
| 2022 | $3,496 | $268,509 | $0 | $0 |
| 2021 | $2,321 | $188,086 | $0 | $0 |
| 2020 | $2,221 | $250,370 | $15,300 | $235,070 |
| 2019 | $2,193 | $228,263 | $15,300 | $212,963 |
| 2018 | $2,167 | $197,102 | $12,750 | $184,352 |
| 2017 | $2,160 | $174,278 | $11,480 | $162,798 |
| 2016 | $2,187 | $170,693 | $14,000 | $156,693 |
| 2015 | $2,220 | $169,506 | $20,610 | $148,896 |
| 2014 | $2,311 | $170,662 | $22,188 | $148,474 |
Source: Public Records
Map
Nearby Homes
- 1141 N Cherry Pop Dr
- 1136 N Cherry Pop Dr
- 898 E Liberty St
- 1085 N Spend A Buck Dr
- 636 N Cherry Pop Dr
- 1464 N Hambletonian Dr
- 1200 N Annapolis Ave
- 869 N Kensington Ave
- 1037 E Hartford St
- 1473 E Saint Charles Place
- 1455 E Hartford St
- 787 E Reehill St
- 631 E Liberty St
- 1329 N Mediterranean Way
- 791 E Hartford St Unit 1B
- 1843 E Saint James Loop
- 1191 N Chance Way
- 771 E Hartford St
- 810 E Gilchrist Ct Unit 2A
- 810 E Gilchrist Ct Unit 3B
- 1201 N Cherry Pop Dr
- 1136 N Cherry Pop Dr
- 1188 N Hambletonian Dr
- 1233 N Cherry Pop Dr
- 1160 N Hambletonian Dr
- 15 N Cherry Pop E Alle Corner
- 1178 N Cherry Pop Dr
- 1214 N Hambletonian Dr
- 1136 1136 Cherry Pop Dr
- 1208 N Cherry Pop Dr
- 1055 E Liberty St
- 1277 N Cherry Pop Dr
- 1132 N Hambletonian Dr
- 1234 N Cherry Pop Dr
- 1104 N Hambletonian Dr
- 1082 N Cherry Pop Dr
- 316 N Cherry Pop Dr
- 0 N Cherry Pop Dr
- 1278 N Cherry Pop Dr
- 1289 N Cherry Pop Dr
Your Personal Tour Guide
Ask me questions while you tour the home.