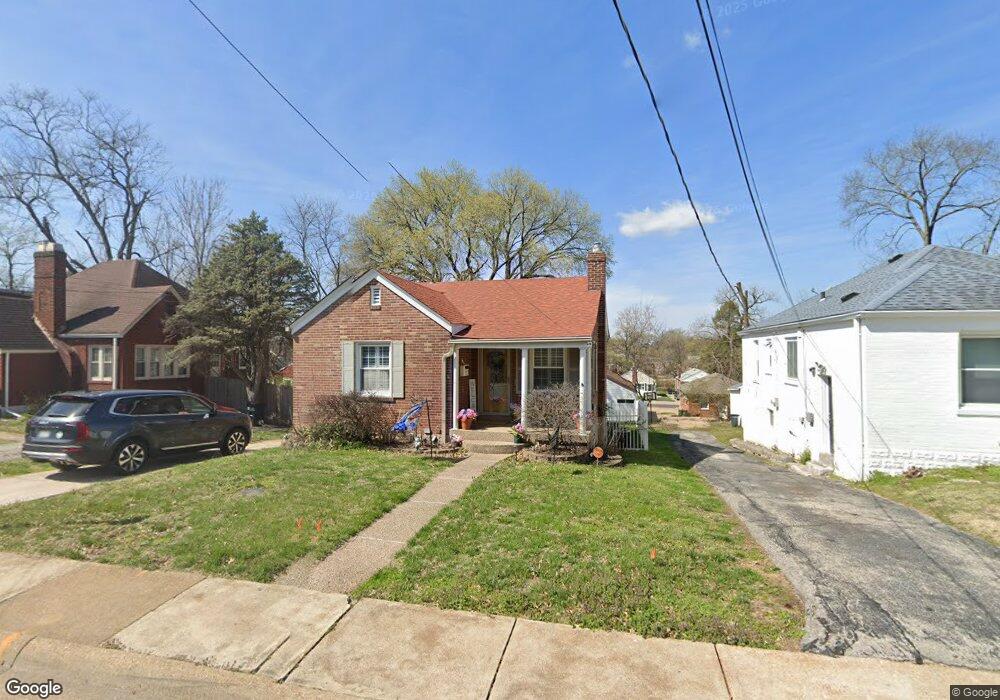
1169 Partridge Ave Saint Louis, MO 63130
Estimated Value: $182,445 - $221,000
3
Beds
2
Baths
1,761
Sq Ft
$117/Sq Ft
Est. Value
About This Home
This home is located at 1169 Partridge Ave, Saint Louis, MO 63130 and is currently estimated at $205,611, approximately $116 per square foot. 1169 Partridge Ave is a home located in St. Louis County with nearby schools including Jackson Park Elementary School, Brittany Woods Middle School, and University City High School.
Ownership History
Date
Name
Owned For
Owner Type
Purchase Details
Closed on
Jan 29, 2021
Sold by
Flaggs Terrance D and Flaggs Cortilya L
Bought by
Flaggs Cortilya L
Current Estimated Value
Purchase Details
Closed on
Feb 28, 2012
Sold by
Mccrary William and Mccrary Angela R
Bought by
Flaggs Terrance D and Flaggs Cortilya L
Home Financials for this Owner
Home Financials are based on the most recent Mortgage that was taken out on this home.
Original Mortgage
$121,831
Outstanding Balance
$85,479
Interest Rate
4.4%
Mortgage Type
FHA
Estimated Equity
$120,132
Purchase Details
Closed on
Jul 14, 1999
Sold by
Mccrary William M and Mccrary Annie M
Bought by
Mccrary William and Mccrary Angela R
Home Financials for this Owner
Home Financials are based on the most recent Mortgage that was taken out on this home.
Original Mortgage
$36,000
Interest Rate
7.39%
Create a Home Valuation Report for This Property
The Home Valuation Report is an in-depth analysis detailing your home's value as well as a comparison with similar homes in the area
Home Values in the Area
Average Home Value in this Area
Purchase History
| Date | Buyer | Sale Price | Title Company |
|---|---|---|---|
| Flaggs Cortilya L | -- | None Available | |
| Flaggs Terrance D | $125,000 | None Available | |
| Mccrary William | -- | -- |
Source: Public Records
Mortgage History
| Date | Status | Borrower | Loan Amount |
|---|---|---|---|
| Open | Flaggs Terrance D | $121,831 | |
| Previous Owner | Mccrary William | $36,000 |
Source: Public Records
Tax History Compared to Growth
Tax History
| Year | Tax Paid | Tax Assessment Tax Assessment Total Assessment is a certain percentage of the fair market value that is determined by local assessors to be the total taxable value of land and additions on the property. | Land | Improvement |
|---|---|---|---|---|
| 2025 | $2,102 | $34,910 | $6,730 | $28,180 |
| 2024 | $2,102 | $29,130 | $2,300 | $26,830 |
| 2023 | $2,099 | $29,130 | $2,300 | $26,830 |
| 2022 | $1,715 | $22,060 | $2,300 | $19,760 |
| 2021 | $1,698 | $22,060 | $2,300 | $19,760 |
| 2020 | $1,827 | $23,180 | $5,740 | $17,440 |
| 2019 | $1,810 | $23,180 | $5,740 | $17,440 |
| 2018 | $1,872 | $22,190 | $3,460 | $18,730 |
| 2017 | $1,876 | $22,190 | $3,460 | $18,730 |
| 2016 | $1,889 | $21,400 | $3,840 | $17,560 |
| 2015 | $1,897 | $21,400 | $3,840 | $17,560 |
| 2014 | $1,437 | $15,790 | $2,360 | $13,430 |
Source: Public Records
Map
Nearby Homes
- 7039 Plymouth Ave
- 7048 Raymond Ave
- 7012 Melrose Ave
- 1118 George St
- 6954 Plymouth Ave
- 1085 Pennsylvania Ave
- 6934 Julian Ave
- 6937 Etzel Ave
- 6922 Plymouth Ave
- 7315 Ahern Ave
- 1251 Waldron Ave
- 7060 Canton Ave
- 7171 White Oak Ln
- 7032 Canton Ave
- 6835 Etzel Ave
- 7343 Drexel Dr
- 1209 Griefield Place
- 1101 W Parkedge Ln
- 1207 Buckner Place
- 6821 Raymond Ave
- 1173 Partridge Ave
- 1177 Partridge Ave
- 1161 Partridge Ave
- 1150 Watts Ave
- 1146 Watts Ave
- 1152 Watts Ave
- 7077 Plymouth Ave
- 1142 Watts Ave
- 1181 Partridge Ave
- 1157 Partridge Ave
- 1154 Watts Ave
- 7076 Julian Ave
- 7073 Plymouth Ave
- 1138 Watts Ave
- 1158 Watts Ave
- 1153 Partridge Ave
- 1187 Partridge Ave
- 1136 Watts Ave
- 7069 Plymouth Ave
- 1162 Watts Ave