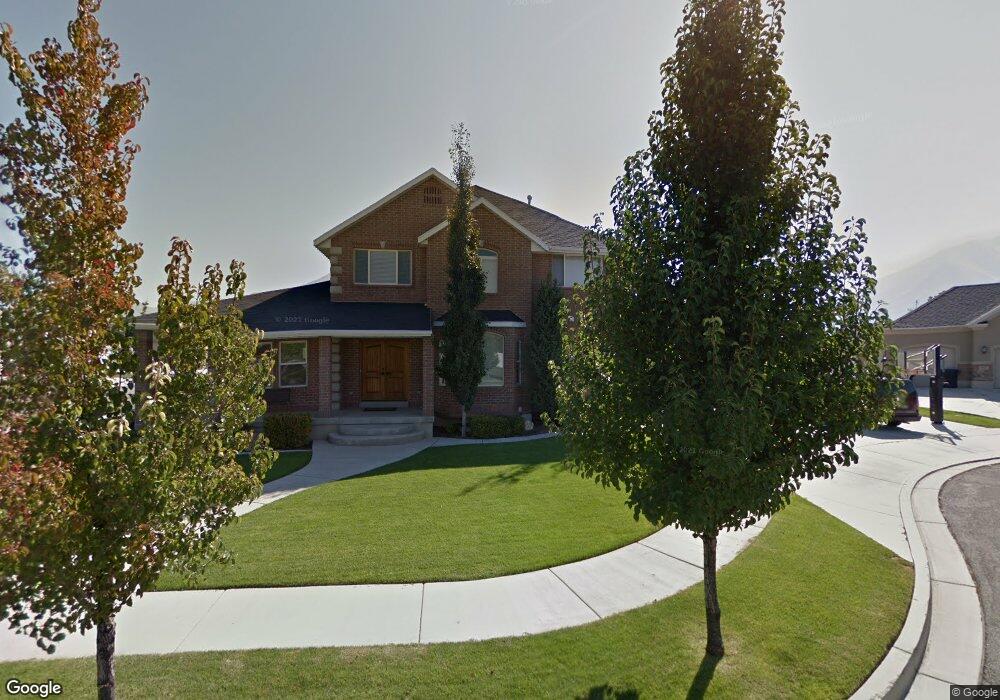
1169 S 1290 E Spanish Fork, UT 84660
Estimated Value: $582,000 - $806,000
5
Beds
3
Baths
2,703
Sq Ft
$266/Sq Ft
Est. Value
About This Home
This home is located at 1169 S 1290 E, Spanish Fork, UT 84660 and is currently estimated at $719,053, approximately $266 per square foot. 1169 S 1290 E is a home located in Utah County with nearby schools including Canyon Elementary School, Spanish Fork Jr High School, and Spanish Fork High School.
Ownership History
Date
Name
Owned For
Owner Type
Purchase Details
Closed on
Oct 30, 2000
Sold by
Coffman J Earl and Coffman Christine
Bought by
Argyle Cory A
Current Estimated Value
Home Financials for this Owner
Home Financials are based on the most recent Mortgage that was taken out on this home.
Original Mortgage
$200,000
Interest Rate
8.07%
Mortgage Type
Construction
Purchase Details
Closed on
Sep 21, 2000
Sold by
M & A Development Lc
Bought by
Stucki Brian Kelly and Stucki Regan Simonsen
Home Financials for this Owner
Home Financials are based on the most recent Mortgage that was taken out on this home.
Original Mortgage
$200,000
Interest Rate
8.07%
Mortgage Type
Construction
Purchase Details
Closed on
Mar 24, 2000
Sold by
M & A Development Llc
Bought by
Coffman J Earl and Coffman Christine
Home Financials for this Owner
Home Financials are based on the most recent Mortgage that was taken out on this home.
Original Mortgage
$35,000
Interest Rate
8.34%
Create a Home Valuation Report for This Property
The Home Valuation Report is an in-depth analysis detailing your home's value as well as a comparison with similar homes in the area
Home Values in the Area
Average Home Value in this Area
Purchase History
| Date | Buyer | Sale Price | Title Company |
|---|---|---|---|
| Argyle Cory A | -- | Sundance Title Insurance | |
| Stucki Brian Kelly | -- | Sundance Title Insurance | |
| Coffman J Earl | -- | Sundance Title Insurance |
Source: Public Records
Mortgage History
| Date | Status | Borrower | Loan Amount |
|---|---|---|---|
| Closed | Stucki Brian Kelly | $200,000 | |
| Previous Owner | Coffman J Earl | $35,000 |
Source: Public Records
Tax History Compared to Growth
Tax History
| Year | Tax Paid | Tax Assessment Tax Assessment Total Assessment is a certain percentage of the fair market value that is determined by local assessors to be the total taxable value of land and additions on the property. | Land | Improvement |
|---|---|---|---|---|
| 2025 | $272 | $390,665 | $195,200 | $515,100 |
| 2024 | $272 | $345,290 | $0 | $0 |
| 2023 | $200 | $353,100 | $0 | $0 |
| 2022 | $706 | $362,945 | $0 | $0 |
| 2021 | $3,202 | $518,400 | $116,600 | $401,800 |
| 2020 | $2,973 | $468,000 | $106,000 | $362,000 |
| 2019 | $2,790 | $462,000 | $100,000 | $362,000 |
| 2018 | $2,624 | $420,100 | $92,600 | $327,500 |
| 2017 | $2,591 | $222,915 | $0 | $0 |
| 2016 | $2,400 | $203,775 | $0 | $0 |
| 2015 | $2,174 | $182,380 | $0 | $0 |
| 2014 | $2,166 | $182,380 | $0 | $0 |
Source: Public Records
Map
Nearby Homes
- 1110 E 1025 S
- 1112 S 1660 E
- 1033 S 1560 E
- 886 S 1240 E
- 857 S 1300 E Unit 32
- 857 S 1300 E
- 246 E 860 S Unit 162
- 232 E 860 S Unit 158
- 244 E 860 S Unit 161
- 222 E 860 S Unit 154
- 834 S 1300 #16gc E
- 993 S 1660 E
- 815 S 1300 E Unit 34
- 815 S 1300 E
- 762 S 1360 E
- 762 S 1360 E Unit 25
- 1507 E 820 S
- 2308 E 850 South St Unit 10
- 228 E 800 S Unit 131
- 938 S 1740 E
- 1334 E 1150 S
- 1187 S 1290 E
- 1202 S 1340 E
- 1202 S 1340 E Unit 9B
- 1313 E 1150 S
- 1327 E 1150 S
- 1166 S 1290 E
- 1293 E 1150 S
- 1204 S 1290 E
- 1208 S 1340 E
- 1184 S 1290 E
- 1339 E 1150 S
- 1169 S 1340 E
- 1169 S 1340 E Unit 3B
- 1216 S 1340 E
- 1281 E 1150 S
- 1193 S 1340 E
- 1193 S 1340 E Unit 4B
- 1322 E 1100 S Unit 30
- 1363 E 1150 S