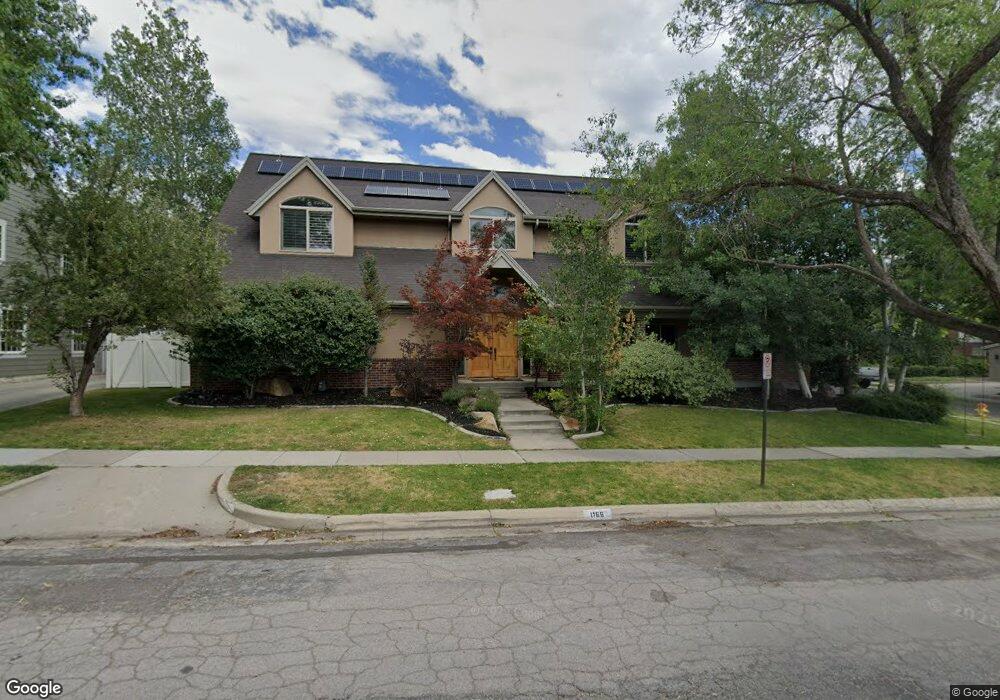
1169 S 2000 E Salt Lake City, UT 84108
Foothill Sunnyside NeighborhoodEstimated Value: $1,732,000 - $2,383,000
6
Beds
4
Baths
5,224
Sq Ft
$384/Sq Ft
Est. Value
About This Home
This home is located at 1169 S 2000 E, Salt Lake City, UT 84108 and is currently estimated at $2,005,554, approximately $383 per square foot. 1169 S 2000 E is a home located in Salt Lake County with nearby schools including Bonneville School, Clayton Middle School, and East High School.
Ownership History
Date
Name
Owned For
Owner Type
Purchase Details
Closed on
Apr 27, 2019
Sold by
Calvert Stephen J and Calvert Celeste
Bought by
Zebrack James S
Current Estimated Value
Home Financials for this Owner
Home Financials are based on the most recent Mortgage that was taken out on this home.
Original Mortgage
$879,200
Outstanding Balance
$774,549
Interest Rate
4.3%
Mortgage Type
New Conventional
Estimated Equity
$1,231,005
Purchase Details
Closed on
May 23, 2016
Sold by
Calvert Stephen J
Bought by
Calvert Stephen J and Calvert Celeste
Home Financials for this Owner
Home Financials are based on the most recent Mortgage that was taken out on this home.
Original Mortgage
$591,750
Interest Rate
3.59%
Mortgage Type
New Conventional
Purchase Details
Closed on
Dec 21, 2012
Sold by
Nightingale Daniel Ray and Nightingale Martha Sahuc
Bought by
Nightingale Daniel and Nightingale Martha
Purchase Details
Closed on
Aug 10, 2011
Sold by
Swanson Eric R and Swanson Trece B
Bought by
Nightingale Daniel Ray and Nightingale Martha Sahuc
Home Financials for this Owner
Home Financials are based on the most recent Mortgage that was taken out on this home.
Original Mortgage
$519,824
Interest Rate
4.46%
Mortgage Type
New Conventional
Purchase Details
Closed on
May 26, 2005
Sold by
Luttmer Grant and Luttmer Margaret
Bought by
Swanson Eric R and Swanson Trece B
Home Financials for this Owner
Home Financials are based on the most recent Mortgage that was taken out on this home.
Original Mortgage
$182,000
Interest Rate
5.84%
Mortgage Type
Credit Line Revolving
Purchase Details
Closed on
Nov 3, 2003
Sold by
Zhou Ning and Cheng Tong
Bought by
Luttmer Grant and Luttmer Margaret
Home Financials for this Owner
Home Financials are based on the most recent Mortgage that was taken out on this home.
Original Mortgage
$250,000
Interest Rate
6.04%
Mortgage Type
Purchase Money Mortgage
Create a Home Valuation Report for This Property
The Home Valuation Report is an in-depth analysis detailing your home's value as well as a comparison with similar homes in the area
Home Values in the Area
Average Home Value in this Area
Purchase History
| Date | Buyer | Sale Price | Title Company |
|---|---|---|---|
| Zebrack James S | -- | Title Guarantee S Jordan | |
| Calvert Stephen J | -- | Title Guarantee S Jordan | |
| Calvert Stephen J | -- | Paramount Title | |
| Nightingale Daniel | -- | None Available | |
| Nightingale Daniel Ray | -- | Paramount Title | |
| Swanson Eric R | -- | Equity Title | |
| Luttmer Grant | -- | Sutherland Title |
Source: Public Records
Mortgage History
| Date | Status | Borrower | Loan Amount |
|---|---|---|---|
| Open | Zebrack James S | $879,200 | |
| Previous Owner | Calvert Stephen J | $591,750 | |
| Previous Owner | Nightingale Daniel Ray | $519,824 | |
| Previous Owner | Swanson Eric R | $182,000 | |
| Previous Owner | Luttmer Grant | $250,000 |
Source: Public Records
Tax History Compared to Growth
Tax History
| Year | Tax Paid | Tax Assessment Tax Assessment Total Assessment is a certain percentage of the fair market value that is determined by local assessors to be the total taxable value of land and additions on the property. | Land | Improvement |
|---|---|---|---|---|
| 2025 | $7,582 | $1,526,400 | $462,500 | $1,063,900 |
| 2024 | $7,582 | $1,446,700 | $441,300 | $1,005,400 |
| 2023 | $7,582 | $1,349,400 | $424,300 | $925,100 |
| 2022 | $7,831 | $1,351,200 | $416,000 | $935,200 |
| 2021 | $7,278 | $1,137,000 | $338,000 | $799,000 |
| 2020 | $7,545 | $1,122,000 | $328,700 | $793,300 |
| 2019 | $6,690 | $935,900 | $328,700 | $607,200 |
| 2018 | $6,390 | $870,600 | $328,700 | $541,900 |
| 2017 | $6,292 | $803,100 | $281,700 | $521,400 |
| 2016 | $6,218 | $753,700 | $219,500 | $534,200 |
| 2015 | $5,913 | $679,300 | $215,100 | $464,200 |
| 2014 | $5,708 | $650,500 | $215,100 | $435,400 |
Source: Public Records
Map
Nearby Homes
- 2008 E Laird Dr
- 1929 Laird Dr
- 1170 S Foothill Dr Unit 311
- 1182 S Foothill Dr Unit 511
- 1845 E Yalecrest Ave
- 1219 S 1800 E
- 2034 E Hubbard Ave
- 1769 Herbert Ave S
- 1763 Herbert Ave S
- 1920 Sunnyside Ave S
- 1644 E Princeton Ave
- 2259 E Hubbard Ave
- 1775 E Rosecrest Dr
- 1540 Preston St
- 1740 E Sunnyside Ave
- 1662 E Browning Ave
- 1583 S 1900 E
- 1970 E Tartan Ave
- 1444 Beacon Dr
- 966 S Diestel Rd
- 2009 Princeton Ave
- 1151 S 2000 E
- 1967 Princeton Ave
- 1967 E Princeton Ave
- 2015 Princeton Ave
- 2015 E Princeton Ave
- 1147 S 2000 E
- 1183 S 2000 E
- 2002 Princeton Ave S
- 2021 Princeton Ave
- 2010 Princeton Ave
- 1959 E Princeton Ave
- 1959 Princeton Ave
- 1139 S 2000 E
- 1970 Princeton Ave
- 1970 E Princeton Ave
- 2014 Princeton Ave
- 2014 E Princeton Ave
- 2025 Princeton Ave
- 1955 E Princeton Ave