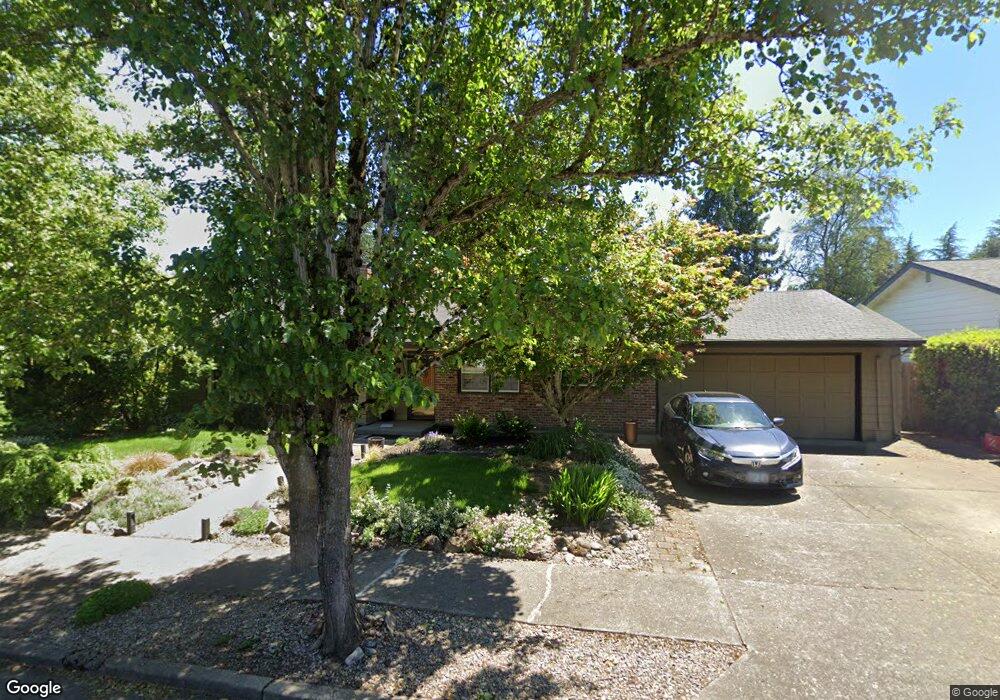
11690 SW Ridgecrest Dr Beaverton, OR 97008
Vose NeighborhoodEstimated Value: $565,000 - $613,000
3
Beds
3
Baths
2,010
Sq Ft
$296/Sq Ft
Est. Value
About This Home
This home is located at 11690 SW Ridgecrest Dr, Beaverton, OR 97008 and is currently estimated at $595,752, approximately $296 per square foot. 11690 SW Ridgecrest Dr is a home located in Washington County with nearby schools including Vose Elementary School, Whitford Middle School, and Southridge High School.
Ownership History
Date
Name
Owned For
Owner Type
Purchase Details
Closed on
Jul 20, 2009
Sold by
Mcmullen Christopher E
Bought by
Mcmullen Chris E and Mcmullen Susan E
Current Estimated Value
Home Financials for this Owner
Home Financials are based on the most recent Mortgage that was taken out on this home.
Original Mortgage
$236,060
Outstanding Balance
$156,245
Interest Rate
5.59%
Mortgage Type
FHA
Estimated Equity
$439,507
Purchase Details
Closed on
Apr 27, 2000
Sold by
Sahli Cynthia A
Bought by
Mcmullen Christopher E
Home Financials for this Owner
Home Financials are based on the most recent Mortgage that was taken out on this home.
Original Mortgage
$174,600
Interest Rate
8.24%
Purchase Details
Closed on
Jun 6, 1996
Sold by
Nandakumar Vallath and Nandakumar Prema M
Bought by
Sahli Cynthia A
Home Financials for this Owner
Home Financials are based on the most recent Mortgage that was taken out on this home.
Original Mortgage
$104,500
Interest Rate
6.25%
Create a Home Valuation Report for This Property
The Home Valuation Report is an in-depth analysis detailing your home's value as well as a comparison with similar homes in the area
Home Values in the Area
Average Home Value in this Area
Purchase History
| Date | Buyer | Sale Price | Title Company |
|---|---|---|---|
| Mcmullen Chris E | -- | Fidelity Natl Title Co Of Or | |
| Mcmullen Christopher E | $180,000 | Pacific Nw Title | |
| Sahli Cynthia A | $151,500 | -- |
Source: Public Records
Mortgage History
| Date | Status | Borrower | Loan Amount |
|---|---|---|---|
| Open | Mcmullen Chris E | $236,060 | |
| Closed | Mcmullen Christopher E | $174,600 | |
| Previous Owner | Sahli Cynthia A | $104,500 |
Source: Public Records
Tax History Compared to Growth
Tax History
| Year | Tax Paid | Tax Assessment Tax Assessment Total Assessment is a certain percentage of the fair market value that is determined by local assessors to be the total taxable value of land and additions on the property. | Land | Improvement |
|---|---|---|---|---|
| 2025 | $6,039 | $286,220 | -- | -- |
| 2024 | $5,702 | $277,890 | -- | -- |
| 2023 | $5,702 | $269,800 | $0 | $0 |
| 2022 | $5,457 | $269,800 | $0 | $0 |
| 2021 | $5,266 | $254,330 | $0 | $0 |
| 2020 | $5,106 | $246,930 | $0 | $0 |
| 2019 | $4,945 | $239,740 | $0 | $0 |
| 2018 | $4,787 | $232,760 | $0 | $0 |
| 2017 | $4,608 | $225,990 | $0 | $0 |
| 2016 | $4,448 | $219,410 | $0 | $0 |
| 2015 | $4,282 | $213,020 | $0 | $0 |
| 2014 | $4,191 | $206,820 | $0 | $0 |
Source: Public Records
Map
Nearby Homes
- 11420 SW Timberline Dr
- 11220 SW Bel Aire Ln Unit 9
- 12119 SW Tesla Terrace
- 7720 SW Bel Aire Dr
- 7765 SW Matheny Dr
- 7505 SW Alpine Dr
- 7795 SW Matheny Dr
- 11990 SW Denney Rd
- 7560 SW Escalon Place
- 8395 SW Berryhill Ln
- 8670 SW Indian Hill Ln
- 6820 SW Queen Ln
- 11825 SW Baker St
- 6720 SW Sussex St
- 6780 SW Hall Blvd
- 7225 SW Juniper Terrace
- 13010 SW Barberry Dr
- 12960 SW Hart Rd
- 8050 SW 103rd Ave
- 10440 SW Denney Rd
- 11700 SW Ridgecrest Dr
- 11670 SW Ridgecrest Dr
- 11655 SW Bel Aire Ln
- 11675 SW Bel Aire Ln
- 11720 SW Ridgecrest Dr
- 11625 SW Bel Aire Ln
- 11725 SW Ridgecrest Dr
- 11755 SW Ridgecrest Dr
- 11650 SW Ridgecrest Dr
- 11605 SW Cardinal Terrace
- 11695 SW Ridgecrest Dr
- 11775 SW Ridgecrest Dr
- 11675 SW Ridgecrest Dr
- 11795 SW Ridgecrest Dr
- 11620 SW Ridgecrest Dr
- 11595 SW Cardinal Terrace
- 11760 SW Timberline Dr
- 11770 SW Timberline Dr
- 11620 SW Re-Listed
- 11660 SW Bel Aire Ln