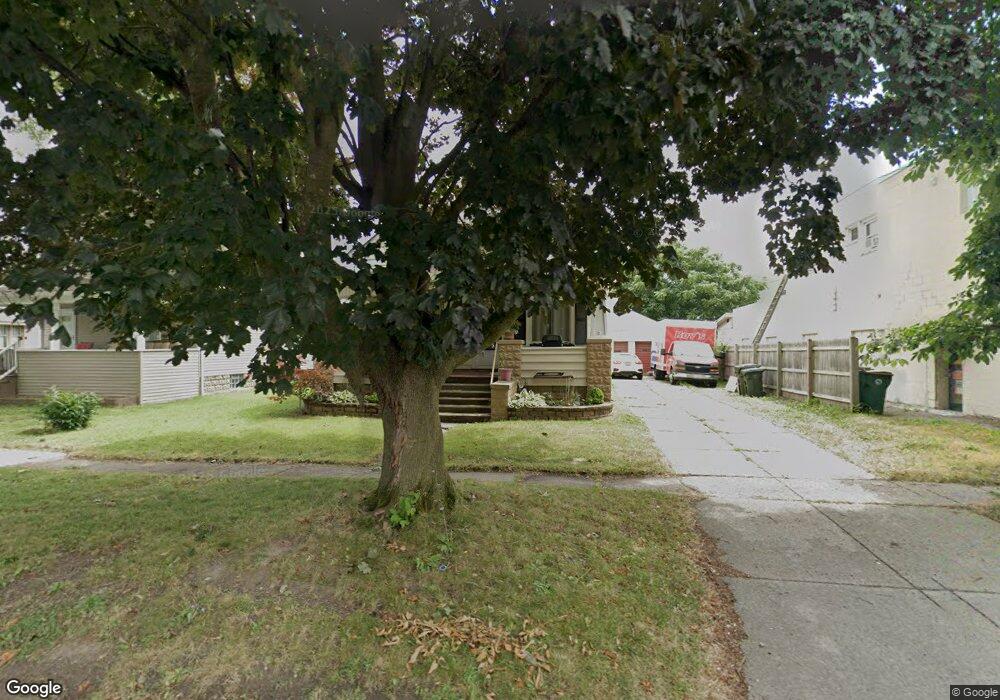
117 5th Ave North Tonawanda, NY 14120
Estimated Value: $129,000 - $216,571
4
Beds
2
Baths
1,670
Sq Ft
$94/Sq Ft
Est. Value
About This Home
This home is located at 117 5th Ave, North Tonawanda, NY 14120 and is currently estimated at $157,393, approximately $94 per square foot. 117 5th Ave is a home located in Niagara County with nearby schools including North Tonawanda Intermediate School and St Matthew Lutheran School.
Ownership History
Date
Name
Owned For
Owner Type
Purchase Details
Closed on
Jun 21, 2019
Sold by
Marshall John K
Bought by
Ohrum Terry L and Ohrum Pamela J
Current Estimated Value
Purchase Details
Closed on
Jan 16, 2009
Sold by
Gniazdowski Helen
Bought by
Ohrum Pamela
Home Financials for this Owner
Home Financials are based on the most recent Mortgage that was taken out on this home.
Original Mortgage
$48,700
Interest Rate
5.28%
Mortgage Type
Purchase Money Mortgage
Purchase Details
Closed on
Apr 22, 2002
Sold by
Gniazdowski Steven
Bought by
Gniazdowski Steven
Create a Home Valuation Report for This Property
The Home Valuation Report is an in-depth analysis detailing your home's value as well as a comparison with similar homes in the area
Home Values in the Area
Average Home Value in this Area
Purchase History
| Date | Buyer | Sale Price | Title Company |
|---|---|---|---|
| Ohrum Terry L | $72,250 | None Available | |
| Ohrum Pamela | $65,000 | Joseph Gannon | |
| Gniazdowski Helen | -- | Edward Markarian | |
| Gniazdowski Steven | -- | -- |
Source: Public Records
Mortgage History
| Date | Status | Borrower | Loan Amount |
|---|---|---|---|
| Previous Owner | Gniazdowski Helen | $48,700 |
Source: Public Records
Tax History Compared to Growth
Tax History
| Year | Tax Paid | Tax Assessment Tax Assessment Total Assessment is a certain percentage of the fair market value that is determined by local assessors to be the total taxable value of land and additions on the property. | Land | Improvement |
|---|---|---|---|---|
| 2024 | $2,295 | $65,000 | $16,300 | $48,700 |
| 2023 | $2,238 | $65,000 | $16,300 | $48,700 |
| 2022 | $2,213 | $65,000 | $16,300 | $48,700 |
| 2021 | $2,199 | $65,000 | $16,300 | $48,700 |
| 2020 | $2,153 | $65,000 | $16,300 | $48,700 |
| 2019 | $2,113 | $65,000 | $16,300 | $48,700 |
| 2018 | $2,145 | $65,000 | $16,300 | $48,700 |
| 2017 | $2,113 | $65,000 | $16,300 | $48,700 |
| 2016 | $2,075 | $65,000 | $16,300 | $48,700 |
| 2015 | -- | $65,000 | $16,300 | $48,700 |
| 2014 | -- | $65,000 | $16,300 | $48,700 |
Source: Public Records
Map
Nearby Homes