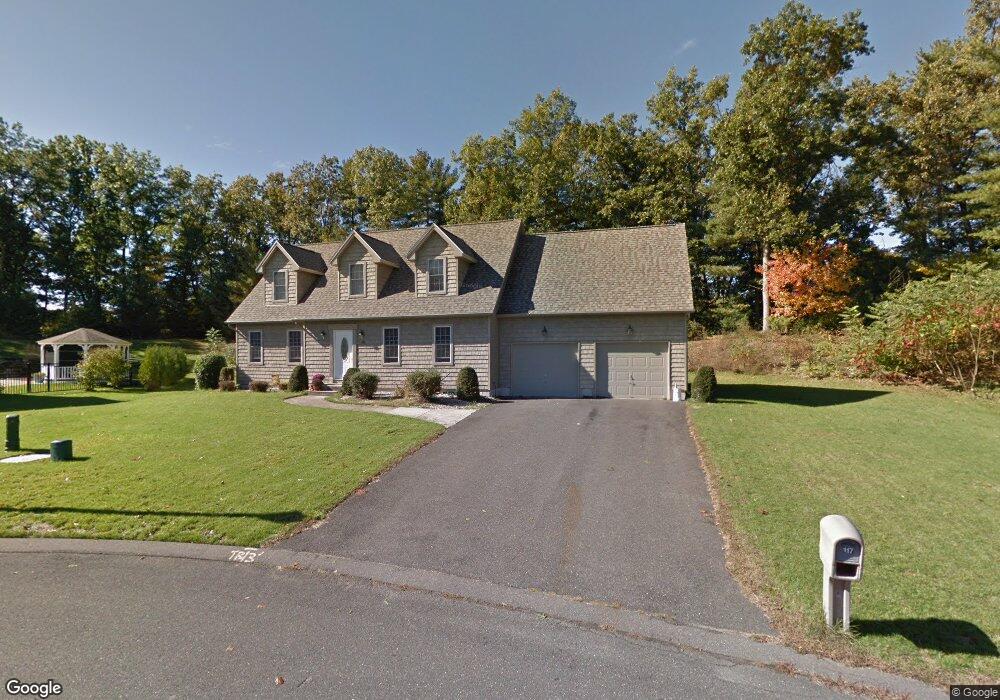
117 Allison Ln Ludlow, MA 01056
Estimated Value: $442,000 - $540,000
3
Beds
3
Baths
1,770
Sq Ft
$277/Sq Ft
Est. Value
About This Home
This home is located at 117 Allison Ln, Ludlow, MA 01056 and is currently estimated at $490,483, approximately $277 per square foot. 117 Allison Ln is a home located in Hampden County with nearby schools including East Street Elementary School, Chapin Street Elementary School, and Paul R. Baird Middle School.
Ownership History
Date
Name
Owned For
Owner Type
Purchase Details
Closed on
Apr 23, 2004
Sold by
Manganaro Home Bldrs I
Bought by
Braz Antonio
Current Estimated Value
Home Financials for this Owner
Home Financials are based on the most recent Mortgage that was taken out on this home.
Original Mortgage
$198,000
Outstanding Balance
$87,235
Interest Rate
5.4%
Mortgage Type
Purchase Money Mortgage
Estimated Equity
$403,248
Create a Home Valuation Report for This Property
The Home Valuation Report is an in-depth analysis detailing your home's value as well as a comparison with similar homes in the area
Home Values in the Area
Average Home Value in this Area
Purchase History
| Date | Buyer | Sale Price | Title Company |
|---|---|---|---|
| Braz Antonio | $298,000 | -- | |
| Braz Antonio | $298,000 | -- |
Source: Public Records
Mortgage History
| Date | Status | Borrower | Loan Amount |
|---|---|---|---|
| Open | Braz Antonio | $198,000 | |
| Closed | Braz Antonio | $198,000 |
Source: Public Records
Tax History
| Year | Tax Paid | Tax Assessment Tax Assessment Total Assessment is a certain percentage of the fair market value that is determined by local assessors to be the total taxable value of land and additions on the property. | Land | Improvement |
|---|---|---|---|---|
| 2025 | $7,714 | $444,600 | $120,200 | $324,400 |
| 2024 | $7,486 | $413,800 | $121,000 | $292,800 |
| 2023 | $7,162 | $367,100 | $106,200 | $260,900 |
| 2022 | $6,779 | $339,100 | $106,200 | $232,900 |
| 2021 | $6,828 | $323,900 | $106,200 | $217,700 |
| 2020 | $6,539 | $317,100 | $104,600 | $212,500 |
| 2019 | $6,182 | $311,900 | $103,600 | $208,300 |
| 2018 | $5,821 | $306,200 | $103,600 | $202,600 |
| 2017 | $5,524 | $298,100 | $99,700 | $198,400 |
| 2016 | $5,341 | $294,600 | $97,700 | $196,900 |
| 2015 | $5,047 | $291,900 | $96,700 | $195,200 |
Source: Public Records
Map
Nearby Homes
- 35 Focosi Ln
- 130 Arnold St
- 3 Letendre Ave
- 113 Skyridge St
- 295 Main St
- 0 N S Main St Io
- 350 West Ave Unit 5
- 42 Berkshire St
- 28 Mockingbird Dr
- 38 Lark Dr
- 46-48 Milton St
- 517 Ideal Ln Unit 702
- 353 Fuller St Unit 45
- 353 Fuller St Unit 6
- 145 Moxon St
- 33 Connolly St
- 175 Fiberloid St
- 72 Chapin Greene Dr
- 84 Chapin Greene Dr
- 0 Center St Unit 73415933
Your Personal Tour Guide
Ask me questions while you tour the home.