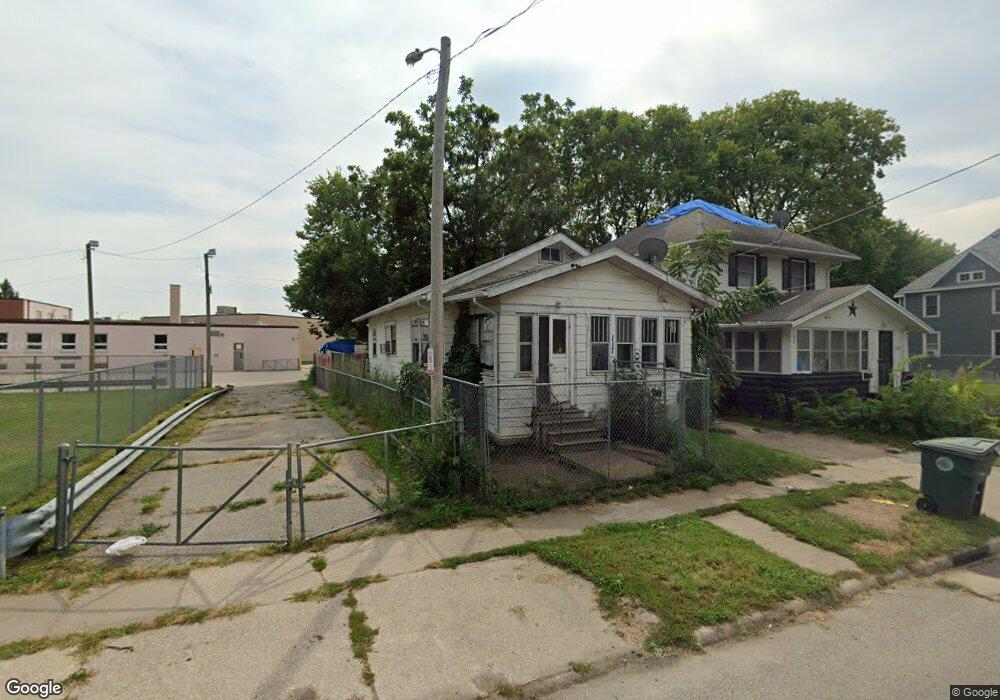
117 Argyle St Waterloo, IA 50703
Franklin Gateway NeighborhoodEstimated Value: $59,810 - $93,000
2
Beds
1
Bath
844
Sq Ft
$84/Sq Ft
Est. Value
About This Home
This home is located at 117 Argyle St, Waterloo, IA 50703 and is currently estimated at $70,937, approximately $84 per square foot. 117 Argyle St is a home located in Black Hawk County with nearby schools including Becker Elementary School, Central Middle School, and West High School.
Ownership History
Date
Name
Owned For
Owner Type
Purchase Details
Closed on
Mar 24, 2026
Sold by
Properties For You Ii Llc
Bought by
Salvation Army
Current Estimated Value
Purchase Details
Closed on
Feb 4, 2026
Sold by
Metro Investments Llc
Bought by
Properties For You Ii Llc
Purchase Details
Closed on
Dec 5, 2007
Sold by
Langan Patrick W and Langan Andrea M
Bought by
Metro Investments Llc
Purchase Details
Closed on
Jan 9, 2007
Sold by
Six Bros Llc
Bought by
Eastside Holdings Llc
Purchase Details
Closed on
Sep 23, 2005
Sold by
Eastside Holdings Llc
Bought by
Six Bros Llc
Create a Home Valuation Report for This Property
The Home Valuation Report is an in-depth analysis detailing your home's value as well as a comparison with similar homes in the area
Home Values in the Area
Average Home Value in this Area
Purchase History
We collect this data history from publicly available records. To have your information removed, we recommend requesting removal directly through your county’s website.
| Date | Buyer | Sale Price | Title Company |
|---|---|---|---|
| Salvation Army | $50,000 | None Listed On Document | |
| Properties For You Ii Llc | $77,000 | None Listed On Document | |
| Metro Investments Llc | $5,000 | None Available | |
| Eastside Holdings Llc | $1,123,000 | None Available | |
| Six Bros Llc | $1,123,000 | None Available |
Source: Public Records
Tax History
| Year | Tax Paid | Tax Assessment Tax Assessment Total Assessment is a certain percentage of the fair market value that is determined by local assessors to be the total taxable value of land and additions on the property. | Land | Improvement |
|---|---|---|---|---|
| 2025 | $516 | $33,480 | $4,360 | $29,120 |
| 2024 | $476 | $23,770 | $4,360 | $19,410 |
| 2023 | $438 | $23,770 | $4,360 | $19,410 |
| 2022 | $608 | $19,930 | $4,360 | $15,570 |
| 2021 | $484 | $19,930 | $4,360 | $15,570 |
| 2020 | $476 | $21,330 | $1,870 | $19,460 |
| 2019 | $476 | $21,330 | $1,870 | $19,460 |
| 2018 | $476 | $21,330 | $1,870 | $19,460 |
| 2017 | $490 | $21,330 | $1,870 | $19,460 |
| 2016 | $484 | $21,330 | $1,870 | $19,460 |
| 2015 | $484 | $21,330 | $1,870 | $19,460 |
| 2014 | $494 | $21,330 | $1,870 | $19,460 |
Source: Public Records
Map
Nearby Homes
- 119 Argyle St
- 229 Logan Ave
- 112 Argyle St
- 114 Argyle St Unit 112
- 127 Argyle St
- 112 Argyle St
- 114 E Argyle St
- 108 Argyle St
- 122 Argyle St
- 118 Argyle St
- 315 Logan Ave
- 140 Argyle St
- 71 Franklin St
- 67 Franklin St
- 222 Logan Ave
- 206 Argyle St
- 101 Argyle Ct Unit 103
- 55 Franklin St
- 216 Logan Ave Unit 218
- 146 Argyle St
Your Personal Tour Guide
Ask me questions while you tour the home.