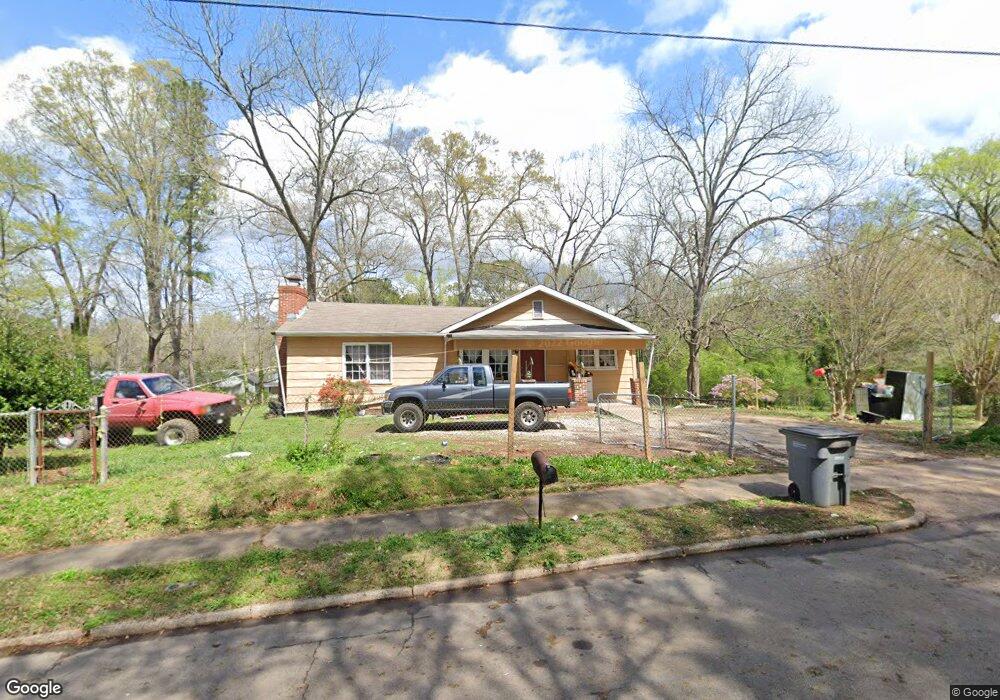
117 Bell St Lagrange, GA 30241
Estimated Value: $28,740 - $192,000
3
Beds
2
Baths
1,550
Sq Ft
$63/Sq Ft
Est. Value
About This Home
This home is located at 117 Bell St, Lagrange, GA 30241 and is currently estimated at $98,185, approximately $63 per square foot. 117 Bell St is a home located in Troup County with nearby schools including Callaway Elementary School, Hogansville Elementary School, and Callaway Middle School.
Ownership History
Date
Name
Owned For
Owner Type
Purchase Details
Closed on
Mar 24, 2020
Sold by
Najarian Capital Llc
Bought by
Castillo Carlos Artemio Martine
Current Estimated Value
Purchase Details
Closed on
Feb 28, 2020
Sold by
Quimbayo Helberth
Bought by
Najarian Capital Llc
Purchase Details
Closed on
Aug 1, 2017
Sold by
Waajid Bilal Ishmael
Bought by
Quimbayo Helberth
Purchase Details
Closed on
Apr 21, 2008
Sold by
Ogletree Adell
Bought by
Waajid Bilal Ishmael
Purchase Details
Closed on
May 25, 1989
Sold by
Waajid Bilal
Bought by
Adell Ogletree
Purchase Details
Closed on
Apr 28, 1989
Sold by
Holt Annie Maud
Bought by
Waajid Bilal
Purchase Details
Closed on
Sep 9, 1985
Sold by
Ogletree Adell
Bought by
Holt Annie Maud
Purchase Details
Closed on
Apr 17, 1970
Sold by
Ogletree Walker Etal
Bought by
Ogletree Adell
Purchase Details
Closed on
Nov 1, 1929
Bought by
Ogletree Walker Etal
Create a Home Valuation Report for This Property
The Home Valuation Report is an in-depth analysis detailing your home's value as well as a comparison with similar homes in the area
Purchase History
| Date | Buyer | Sale Price | Title Company |
|---|---|---|---|
| Castillo Carlos Artemio Martine | $18,000 | -- | |
| Najarian Capital Llc | $5,000 | -- | |
| Quimbayo Helberth | $3,200 | -- | |
| Waajid Bilal Ishmael | -- | -- | |
| Adell Ogletree | -- | -- | |
| Waajid Bilal | -- | -- | |
| Holt Annie Maud | -- | -- | |
| Ogletree Adell | $16,800 | -- | |
| Ogletree Walker Etal | -- | -- |
Source: Public Records
Tax History
| Year | Tax Paid | Tax Assessment Tax Assessment Total Assessment is a certain percentage of the fair market value that is determined by local assessors to be the total taxable value of land and additions on the property. | Land | Improvement |
|---|---|---|---|---|
| 2025 | $877 | $32,160 | $9,760 | $22,400 |
| 2024 | $836 | $30,640 | $9,760 | $20,880 |
| 2023 | $631 | $23,120 | $9,760 | $13,360 |
| 2022 | $626 | $22,440 | $9,760 | $12,680 |
| 2021 | $217 | $27,332 | $4,880 | $22,452 |
| 2020 | $824 | $27,332 | $4,880 | $22,452 |
| 2019 | $676 | $24,396 | $4,892 | $19,504 |
| 2018 | $676 | $24,396 | $4,892 | $19,504 |
| 2017 | $676 | $24,396 | $4,892 | $19,504 |
| 2016 | $668 | $24,148 | $4,892 | $19,256 |
| 2015 | $670 | $24,148 | $4,892 | $19,256 |
| 2014 | $667 | $24,032 | $4,892 | $19,140 |
| 2013 | -- | $25,434 | $4,892 | $20,542 |
Source: Public Records
Map
Nearby Homes
- 109 Bell St
- 103 Cedar St
- 112 Cedar St
- 0 Boggs St Unit 10550243
- 0 Boggs St Unit 10550231
- 0 Boggs St Unit 10550239
- 0 Boggs St Unit 10550250
- 0 Bagley St
- 304 Butler St
- 901 Whiteline St
- 0 E Fendig St
- 113 E Fendig St
- 1191 Whitesville St
- 501 Milam St
- 1201 Whitesville St
- 303 E Mulberry St
- 1404-1406 Hamilton
- 1404 Hamilton Rd
- 1186 Lindsey St
- 203 Fannin St
Your Personal Tour Guide
Ask me questions while you tour the home.