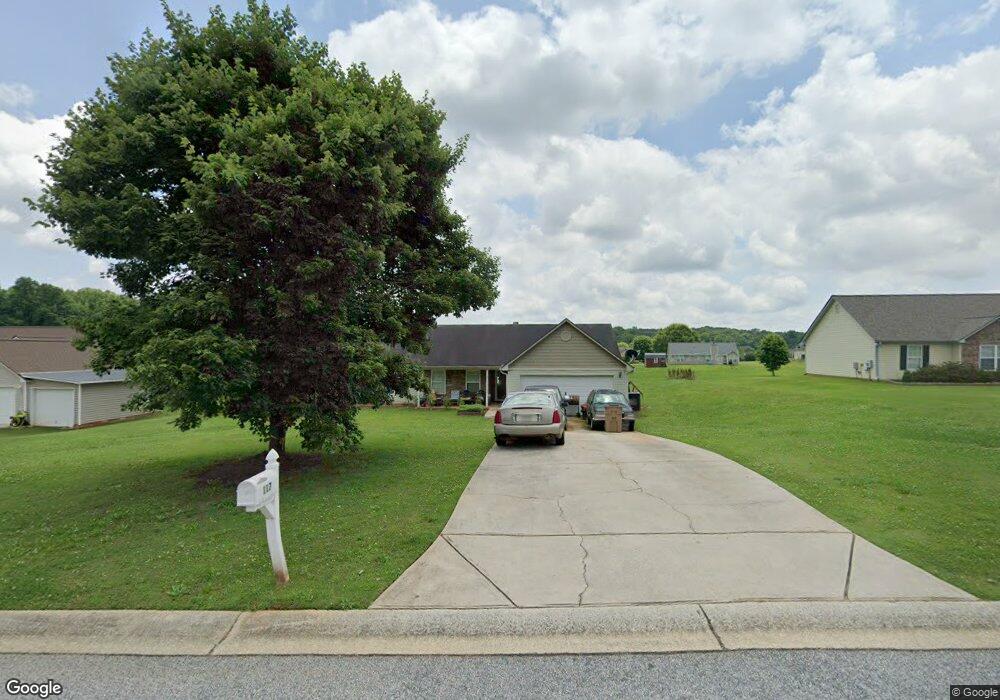
117 Bower Ct Winder, GA 30680
Estimated Value: $302,167 - $356,000
3
Beds
2
Baths
1,403
Sq Ft
$235/Sq Ft
Est. Value
About This Home
This home is located at 117 Bower Ct, Winder, GA 30680 and is currently estimated at $329,292, approximately $234 per square foot. 117 Bower Ct is a home located in Barrow County with nearby schools including Statham Elementary School, Bear Creek Middle School, and Winder-Barrow High School.
Ownership History
Date
Name
Owned For
Owner Type
Purchase Details
Closed on
Feb 24, 2024
Sold by
Davis Debra
Bought by
Davis Debra J
Current Estimated Value
Home Financials for this Owner
Home Financials are based on the most recent Mortgage that was taken out on this home.
Original Mortgage
$458,250
Outstanding Balance
$457,994
Interest Rate
6.69%
Mortgage Type
New Conventional
Estimated Equity
-$128,702
Purchase Details
Closed on
Nov 27, 2006
Sold by
Trammell Const Co Inc
Bought by
Davis Sheldon
Home Financials for this Owner
Home Financials are based on the most recent Mortgage that was taken out on this home.
Original Mortgage
$119,900
Interest Rate
6.36%
Mortgage Type
VA
Purchase Details
Closed on
Nov 4, 2005
Sold by
R & S Developers Llc
Bought by
Trammell Construction Co Inc
Purchase Details
Closed on
Jul 2, 2004
Bought by
R & S Developers Llc
Create a Home Valuation Report for This Property
The Home Valuation Report is an in-depth analysis detailing your home's value as well as a comparison with similar homes in the area
Home Values in the Area
Average Home Value in this Area
Purchase History
| Date | Buyer | Sale Price | Title Company |
|---|---|---|---|
| Davis Debra J | -- | -- | |
| Davis Sheldon | $129,900 | -- | |
| Trammell Construction Co Inc | $38,000 | -- | |
| R & S Developers Llc | -- | -- |
Source: Public Records
Mortgage History
| Date | Status | Borrower | Loan Amount |
|---|---|---|---|
| Open | Davis Debra J | $458,250 | |
| Previous Owner | Davis Sheldon | $119,900 |
Source: Public Records
Tax History
| Year | Tax Paid | Tax Assessment Tax Assessment Total Assessment is a certain percentage of the fair market value that is determined by local assessors to be the total taxable value of land and additions on the property. | Land | Improvement |
|---|---|---|---|---|
| 2025 | $1,909 | $106,478 | $24,000 | $82,478 |
| 2024 | $1,992 | $104,042 | $24,000 | $80,042 |
| 2023 | $2,173 | $100,842 | $20,400 | $80,442 |
| 2022 | $1,503 | $70,391 | $20,400 | $49,991 |
| 2021 | $1,464 | $65,991 | $16,000 | $49,991 |
| 2020 | $1,449 | $65,991 | $16,000 | $49,991 |
| 2019 | $1,252 | $56,520 | $16,000 | $40,520 |
| 2018 | $1,168 | $54,120 | $13,600 | $40,520 |
| 2017 | $1,224 | $42,028 | $13,600 | $28,428 |
| 2016 | $809 | $42,336 | $13,600 | $28,736 |
| 2015 | $821 | $42,644 | $13,600 | $29,044 |
| 2014 | $615 | $36,800 | $7,448 | $29,352 |
| 2013 | -- | $35,346 | $7,448 | $27,898 |
Source: Public Records
Map
Nearby Homes
- 16 Fox Dr
- 1453 Solomon Dr
- 385 Finch Landing Rd
- 315 Paige Way
- 917 Justin Dr Unit 3
- 614 Anns Way
- 973 Vera Ct
- 388 Kay Dr Unit 1
- 1553 Shoal Creek Dr
- 1556 Shoal Creek Dr
- 29 Nunnally Rd SE
- 56 Candler Park Ct
- 246 Pleasant Hill Church Rd NE
- 508 Pleasant Hill Church Rd NE
- 1200 Breckinridge Trail
- 0 Bowman Mill Rd NE Unit 7698431
- 0 Bowman Mill Rd NE Unit 10664956
- 1295 Double Bridges Rd
- 63 Delightful Way Unit 1
- 83 Beech Creek Cir
Your Personal Tour Guide
Ask me questions while you tour the home.