Estimated Value: $98,783 - $137,000
Studio
--
Bath
1,082
Sq Ft
$109/Sq Ft
Est. Value
About This Home
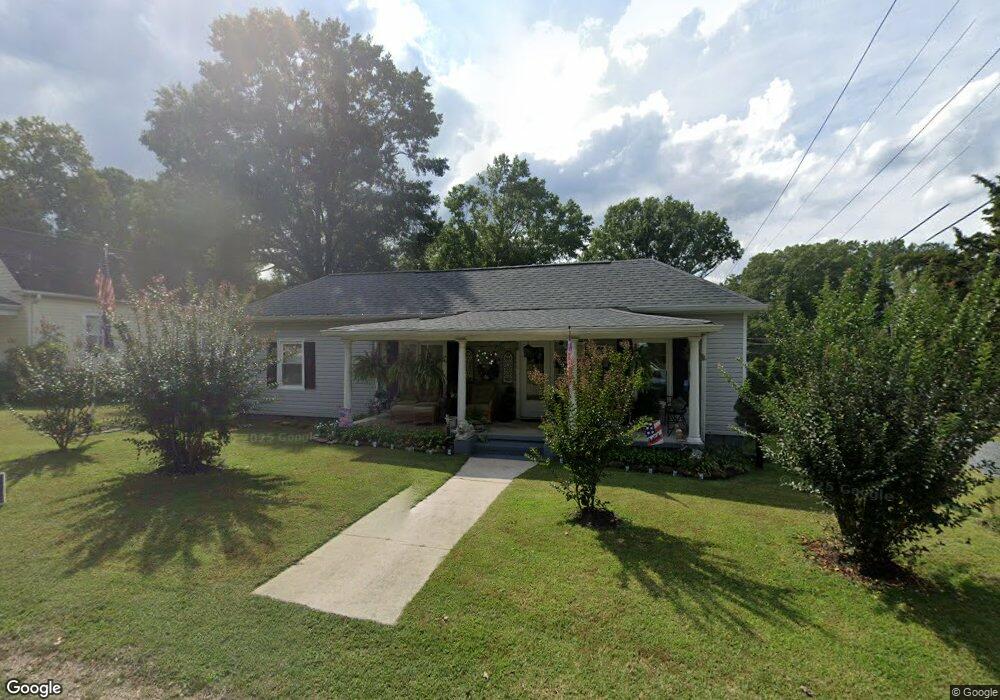
This home is located at 117 Bryant St, Eden, NC 27288 and is currently estimated at $117,946, approximately $109 per square foot. 117 Bryant St is a home located in Rockingham County with nearby schools including Leaksville-Spray Elementary School, J.E. Holmes Middle School, and John M. Morehead High School.
Ownership History
Date
Name
Owned For
Owner Type
Purchase Details
Closed on
Mar 7, 2013
Sold by
Hagood Talmadge E and Hagood Janice O
Bought by
Wood Morris and Wood Ellen
Current Estimated Value
Home Financials for this Owner
Home Financials are based on the most recent Mortgage that was taken out on this home.
Original Mortgage
$49,692
Interest Rate
3.43%
Mortgage Type
Seller Take Back
Create a Home Valuation Report for This Property
The Home Valuation Report is an in-depth analysis detailing your home's value as well as a comparison with similar homes in the area
Home Values in the Area
Average Home Value in this Area
Purchase History
| Date | Buyer | Sale Price | Title Company |
|---|---|---|---|
| Wood Morris | $55,000 | None Available |
Source: Public Records
Mortgage History
| Date | Status | Borrower | Loan Amount |
|---|---|---|---|
| Closed | Wood Morris | $49,692 |
Source: Public Records
Tax History
| Year | Tax Paid | Tax Assessment Tax Assessment Total Assessment is a certain percentage of the fair market value that is determined by local assessors to be the total taxable value of land and additions on the property. | Land | Improvement |
|---|---|---|---|---|
| 2025 | $455 | $86,385 | $10,876 | $75,509 |
| 2024 | $455 | $86,385 | $10,876 | $75,509 |
| 2023 | $455 | $48,474 | $9,888 | $38,586 |
| 2022 | $634 | $48,474 | $9,888 | $38,586 |
| 2021 | $632 | $48,474 | $9,888 | $38,586 |
| 2020 | $634 | $48,474 | $9,888 | $38,586 |
| 2019 | $634 | $48,474 | $9,888 | $38,586 |
| 2018 | $620 | $47,381 | $14,888 | $32,493 |
| 2017 | $621 | $47,381 | $14,888 | $32,493 |
| 2015 | $628 | $47,381 | $14,888 | $32,493 |
| 2014 | -- | $47,381 | $14,888 | $32,493 |
Source: Public Records
Map
Nearby Homes
Your Personal Tour Guide
Ask me questions while you tour the home.