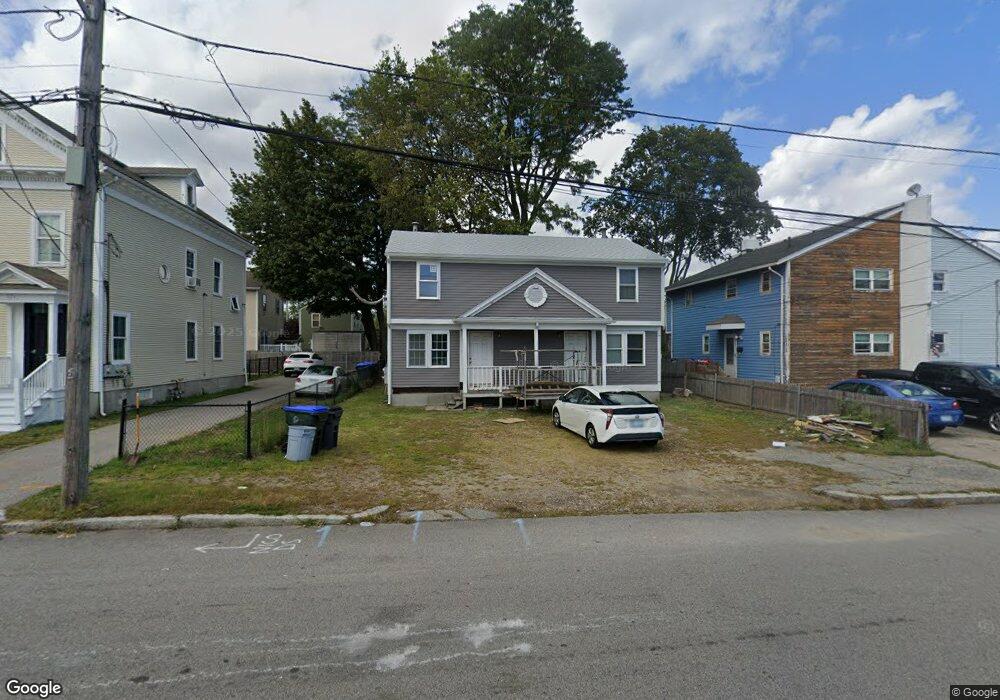
117 Byfield St Providence, RI 02905
Lower South Providence NeighborhoodEstimated Value: $390,000 - $550,000
4
Beds
2
Baths
1,800
Sq Ft
$269/Sq Ft
Est. Value
About This Home
This home is located at 117 Byfield St, Providence, RI 02905 and is currently estimated at $484,652, approximately $269 per square foot. 117 Byfield St is a home located in Providence County with nearby schools including Asa Messer Elementary School, Charles N. Fortes Elementary School, and Alan Shawn Feinstein Elementary.
Ownership History
Date
Name
Owned For
Owner Type
Purchase Details
Closed on
Sep 7, 2005
Sold by
Var Buntheng and Var Monty So
Bought by
Santos Francisca
Current Estimated Value
Home Financials for this Owner
Home Financials are based on the most recent Mortgage that was taken out on this home.
Original Mortgage
$181,600
Outstanding Balance
$96,193
Interest Rate
5.79%
Mortgage Type
Purchase Money Mortgage
Estimated Equity
$388,459
Create a Home Valuation Report for This Property
The Home Valuation Report is an in-depth analysis detailing your home's value as well as a comparison with similar homes in the area
Home Values in the Area
Average Home Value in this Area
Purchase History
| Date | Buyer | Sale Price | Title Company |
|---|---|---|---|
| Santos Francisca | $227,000 | -- |
Source: Public Records
Mortgage History
| Date | Status | Borrower | Loan Amount |
|---|---|---|---|
| Open | Santos Francisca | $30,000 | |
| Open | Santos Francisca | $181,600 | |
| Closed | Santos Francisca | $45,000 |
Source: Public Records
Tax History Compared to Growth
Tax History
| Year | Tax Paid | Tax Assessment Tax Assessment Total Assessment is a certain percentage of the fair market value that is determined by local assessors to be the total taxable value of land and additions on the property. | Land | Improvement |
|---|---|---|---|---|
| 2025 | $5,928 | $423,400 | $121,500 | $301,900 |
| 2024 | $5,413 | $295,000 | $77,000 | $218,000 |
| 2023 | $5,413 | $295,000 | $77,000 | $218,000 |
| 2022 | $5,251 | $295,000 | $77,000 | $218,000 |
| 2021 | $4,517 | $183,900 | $35,400 | $148,500 |
| 2020 | $4,517 | $183,900 | $35,400 | $148,500 |
| 2019 | $4,337 | $176,600 | $35,400 | $141,200 |
| 2018 | $3,848 | $120,400 | $32,200 | $88,200 |
| 2017 | $3,848 | $120,400 | $32,200 | $88,200 |
| 2016 | $3,848 | $120,400 | $32,200 | $88,200 |
| 2015 | $3,476 | $105,000 | $32,200 | $72,800 |
| 2014 | $3,544 | $105,000 | $32,200 | $72,800 |
| 2013 | $3,544 | $105,000 | $32,200 | $72,800 |
Source: Public Records
Map
Nearby Homes
- 115 Byfield St
- 121 Byfield St
- 113 Byfield St
- 336 Ocean St
- 125 Byfield St
- 173 Rugby St
- 176 Pavilion Ave
- 172 Pavilion Ave
- 182 Pavilion Ave
- 167 Rugby St
- 164 Pavilion Ave
- 186 Pavilion Ave
- 129 Byfield St
- 190 Pavilion Ave
- 159 Rugby St
- 12 Rugby St
- 192 Pavilion Ave
- 101 Byfield St
- 181 Pavilion Ave
- 97 Byfield St