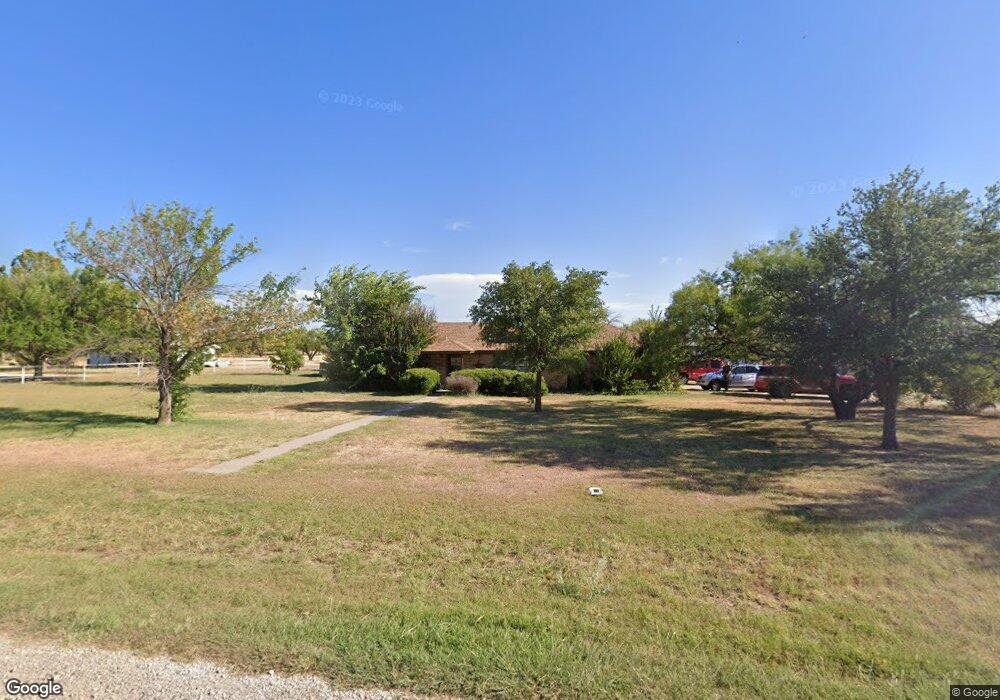
117 Bynum Ln Abilene, TX 79602
Estimated Value: $317,000 - $351,000
3
Beds
2
Baths
1,675
Sq Ft
$198/Sq Ft
Est. Value
About This Home
This home is located at 117 Bynum Ln, Abilene, TX 79602 and is currently estimated at $332,187, approximately $198 per square foot. 117 Bynum Ln is a home located in Taylor County with nearby schools including Wylie West Early Childhood Center, Wylie West Intermediate School, and Wylie West Elementary School.
Ownership History
Date
Name
Owned For
Owner Type
Purchase Details
Closed on
Jun 26, 2008
Sold by
Roschetzky Heather Rice and Roschetzky Gary
Bought by
Maxwell Deborah E and Maxwell Aaron M
Current Estimated Value
Home Financials for this Owner
Home Financials are based on the most recent Mortgage that was taken out on this home.
Original Mortgage
$140,600
Outstanding Balance
$90,613
Interest Rate
6.05%
Mortgage Type
Purchase Money Mortgage
Estimated Equity
$241,574
Purchase Details
Closed on
May 25, 2007
Sold by
Crawford Ronnie D and Crawford Teresa
Bought by
Roschetzky Heather Rice and Roschetzky Gary
Home Financials for this Owner
Home Financials are based on the most recent Mortgage that was taken out on this home.
Original Mortgage
$149,000
Interest Rate
6.22%
Mortgage Type
New Conventional
Create a Home Valuation Report for This Property
The Home Valuation Report is an in-depth analysis detailing your home's value as well as a comparison with similar homes in the area
Home Values in the Area
Average Home Value in this Area
Purchase History
| Date | Buyer | Sale Price | Title Company |
|---|---|---|---|
| Maxwell Deborah E | -- | None Available | |
| Roschetzky Heather Rice | -- | None Available |
Source: Public Records
Mortgage History
| Date | Status | Borrower | Loan Amount |
|---|---|---|---|
| Open | Maxwell Deborah E | $140,600 | |
| Previous Owner | Roschetzky Heather Rice | $149,000 |
Source: Public Records
Tax History Compared to Growth
Tax History
| Year | Tax Paid | Tax Assessment Tax Assessment Total Assessment is a certain percentage of the fair market value that is determined by local assessors to be the total taxable value of land and additions on the property. | Land | Improvement |
|---|---|---|---|---|
| 2025 | $3,367 | $285,743 | $56,448 | $229,295 |
| 2023 | $3,367 | $247,032 | $26,180 | $220,852 |
| 2022 | $3,632 | $227,374 | $26,180 | $201,194 |
| 2021 | $3,739 | $209,081 | $26,180 | $182,901 |
| 2020 | $3,586 | $195,855 | $26,180 | $169,675 |
| 2019 | $3,492 | $184,533 | $26,180 | $158,353 |
| 2018 | $3,095 | $179,087 | $26,180 | $152,907 |
| 2017 | $2,927 | $175,780 | $26,180 | $149,600 |
| 2016 | $2,791 | $167,651 | $26,180 | $141,471 |
| 2015 | $2,190 | $157,330 | $19,799 | $137,531 |
| 2014 | $2,190 | $152,048 | $0 | $0 |
Source: Public Records
Map
Nearby Homes