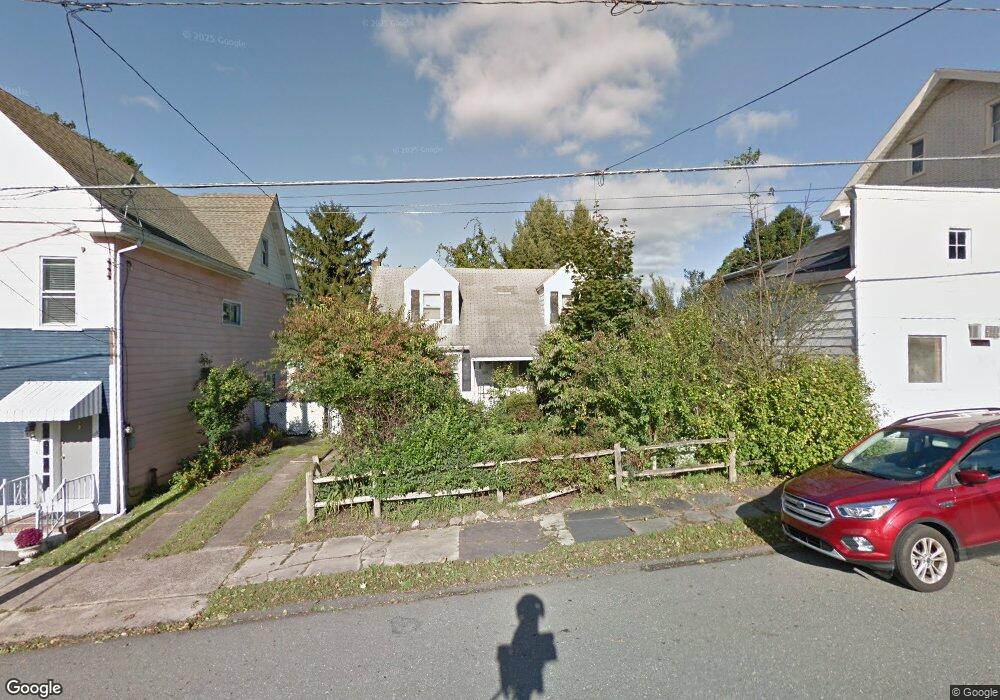
117 Center St Unit 119 Jim Thorpe, PA 18229
Estimated Value: $302,000 - $345,000
4
Beds
3
Baths
1,310
Sq Ft
$246/Sq Ft
Est. Value
About This Home
This home is located at 117 Center St Unit 119, Jim Thorpe, PA 18229 and is currently estimated at $321,606, approximately $245 per square foot. 117 Center St Unit 119 is a home located in Carbon County with nearby schools including Jim Thorpe Area High School and Sts. Peter & Paul School.
Ownership History
Date
Name
Owned For
Owner Type
Purchase Details
Closed on
Jun 23, 2022
Sold by
Richard Walsh
Bought by
Navarro Lisa J
Current Estimated Value
Home Financials for this Owner
Home Financials are based on the most recent Mortgage that was taken out on this home.
Original Mortgage
$252,200
Outstanding Balance
$240,032
Interest Rate
5.3%
Mortgage Type
New Conventional
Estimated Equity
$81,574
Purchase Details
Closed on
Apr 1, 2021
Sold by
Marshall Diane and Estate Of Jacqueline M Marshal
Bought by
Walsh Richard
Purchase Details
Closed on
Dec 13, 2002
Bought by
Marshall Jacqueline M
Create a Home Valuation Report for This Property
The Home Valuation Report is an in-depth analysis detailing your home's value as well as a comparison with similar homes in the area
Home Values in the Area
Average Home Value in this Area
Purchase History
| Date | Buyer | Sale Price | Title Company |
|---|---|---|---|
| Navarro Lisa J | $260,000 | Paramount Abstract | |
| Walsh Richard | -- | Covenant Abstract | |
| Marshall Jacqueline M | -- | -- |
Source: Public Records
Mortgage History
| Date | Status | Borrower | Loan Amount |
|---|---|---|---|
| Open | Navarro Lisa J | $252,200 |
Source: Public Records
Tax History Compared to Growth
Tax History
| Year | Tax Paid | Tax Assessment Tax Assessment Total Assessment is a certain percentage of the fair market value that is determined by local assessors to be the total taxable value of land and additions on the property. | Land | Improvement |
|---|---|---|---|---|
| 2025 | $4,056 | $51,100 | $10,400 | $40,700 |
| 2024 | $3,903 | $51,100 | $10,400 | $40,700 |
| 2023 | $3,831 | $51,100 | $10,400 | $40,700 |
| 2022 | $1,771 | $24,000 | $10,400 | $13,600 |
| 2021 | $1,771 | $24,000 | $10,400 | $13,600 |
| 2020 | $1,709 | $24,000 | $10,400 | $13,600 |
| 2019 | $1,661 | $24,000 | $10,400 | $13,600 |
| 2018 | $1,624 | $24,000 | $10,400 | $13,600 |
| 2017 | $1,576 | $24,000 | $10,400 | $13,600 |
| 2016 | -- | $24,000 | $10,400 | $13,600 |
| 2015 | -- | $24,000 | $10,400 | $13,600 |
| 2014 | -- | $24,000 | $10,400 | $13,600 |
Source: Public Records
Map
Nearby Homes