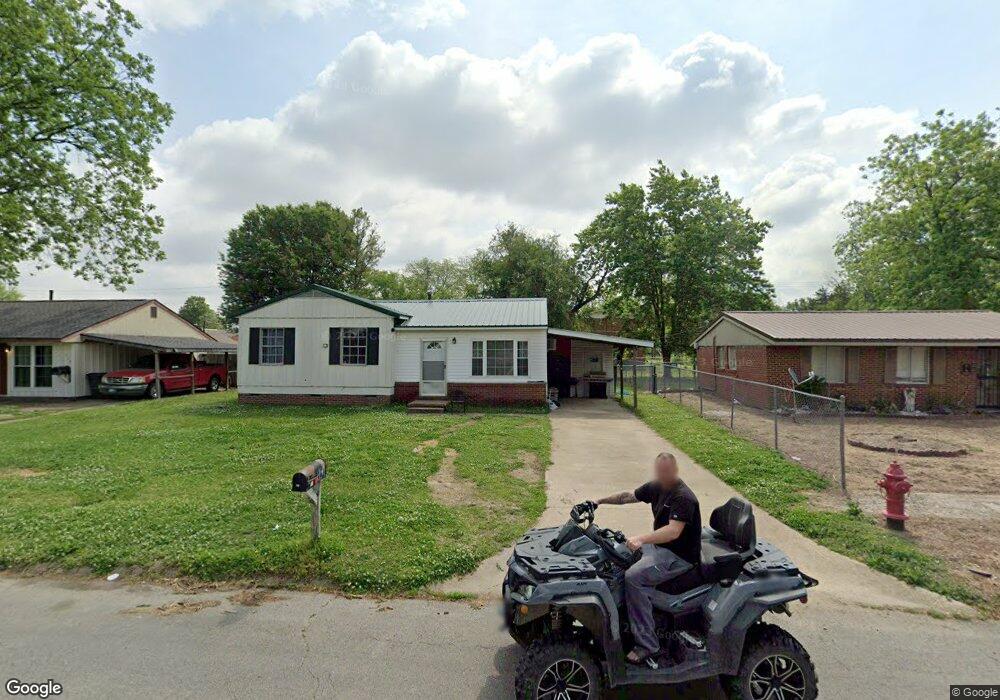
117 Cherry Dr Osceola, AR 72370
Estimated Value: $61,430 - $105,000
Studio
--
Bath
889
Sq Ft
$102/Sq Ft
Est. Value
About This Home
This home is located at 117 Cherry Dr, Osceola, AR 72370 and is currently estimated at $90,358, approximately $101 per square foot. 117 Cherry Dr is a home located in Mississippi County with nearby schools including North Elementary School, Carroll Smith Elementary School, and Osceola High School.
Ownership History
Date
Name
Owned For
Owner Type
Purchase Details
Closed on
Jan 2, 2000
Sold by
Kennemore James H
Bought by
Kennemore James H
Current Estimated Value
Purchase Details
Closed on
Jan 1, 2000
Sold by
Kennemore James H
Bought by
Kennemore James H
Purchase Details
Closed on
Jan 2, 1988
Sold by
Kennemore James H
Bought by
Kennemore James H
Purchase Details
Closed on
Jan 1, 1988
Sold by
Kennemore James H
Bought by
Kennemore James H
Purchase Details
Closed on
Jan 2, 1968
Sold by
Wilkey Ii Roy M
Bought by
Kennemore James H
Purchase Details
Closed on
Jan 1, 1968
Sold by
Wilkey Ii Roy M
Bought by
Kennemore James H
Purchase Details
Closed on
Jan 2, 1965
Sold by
Barnard Dewey W
Bought by
Swallons Ronald Lee
Purchase Details
Closed on
Jan 1, 1965
Sold by
Barnard Dewey W
Bought by
Swallons Ronald Lee
Purchase Details
Closed on
Jan 2, 1963
Bought by
Barnard Dewey W
Purchase Details
Closed on
Jan 1, 1963
Bought by
Barnard Dewey W
Create a Home Valuation Report for This Property
The Home Valuation Report is an in-depth analysis detailing your home's value as well as a comparison with similar homes in the area
Home Values in the Area
Average Home Value in this Area
Purchase History
| Date | Buyer | Sale Price | Title Company |
|---|---|---|---|
| Kennemore James H | -- | -- | |
| Kennemore James H | -- | -- | |
| Kennemore James H | -- | -- | |
| Kennemore James H | -- | -- | |
| Kennemore James H | -- | -- | |
| Wilkey Ii Roy M | -- | -- | |
| Kennemore James H | -- | -- | |
| Wilkey Ii Roy M | -- | -- | |
| Swallons Ronald Lee | -- | -- | |
| Swallons Ronald Lee | -- | -- | |
| Barnard Dewey W | -- | -- | |
| Barnard Dewey W | -- | -- |
Source: Public Records
Tax History
| Year | Tax Paid | Tax Assessment Tax Assessment Total Assessment is a certain percentage of the fair market value that is determined by local assessors to be the total taxable value of land and additions on the property. | Land | Improvement |
|---|---|---|---|---|
| 2025 | $439 | $7,776 | $1,800 | $5,976 |
| 2024 | $427 | $7,776 | $1,800 | $5,976 |
| 2023 | $427 | $7,776 | $1,800 | $5,976 |
| 2022 | $417 | $7,776 | $1,800 | $5,976 |
Source: Public Records
Map
Nearby Homes
- 103 Spruce Ln
- 1210 W Hale Ave
- 1169 S State Highway 119
- 1513 W Semmes Ave
- 910 W Semmes Ave
- 910 N Garden Dr
- 109 Newport Dr
- 111 Colonial Rd
- 205 S Brickey St
- 101 S Brickey St
- 212 E Greenbriar Dr
- 805 W Union Ave
- 816 W Johnson Ave
- 704 W Ford Ave
- 0 Cheryl Unit 43977
- 122 Diane Dr
- 130 Diane Dr
- 606 W Ford Ave
- 132 Ken Dr
- 520 W Quinn Ave
Your Personal Tour Guide
Ask me questions while you tour the home.